October 2021 Newsletter
Table of Contents
Investment Management – 3Q 2021 Investment Letter
Stock Feature — “PayPal’s Strong Network Effects are Expanding Beyond E-Commerce”
Retirement Planning – “Delaying Social Security Benefits is Often the Best Choice for 60-Somethings”
Disclaimer
Investment Management
3Q 2021 Investment Letter
Glass Lake Clients and Prospects:
It was a topsy-turvy quarter as the stock market contended with an interrelated resurgence in Delta variant-fueled Covid-19 cases, major supply constraints, slowing economic activity, unabating high inflation, and volatility in US treasury yields. And that does not include drama on Capital Hill with continued uncertainty on the fates of the $1 trillion infrastructure and $3.5 trillion spending bills, as well as threats of a government shutdown.
All told, the Russell 3000 (ticker IWV), a broad measure of market performance, finished the quarter down 0.1%. It fell 5% from its September 2 closing high as market participants, returning from their summer vacations, took stock of the growing concerns amid an all-time high in most market indices. Still, the Russell 3000 is up 15% year-to-date, inclusive of dividends.
Peeling the onion back a bit, growth stocks did well on an absolute and relative basis through most of the quarter until US treasury yields spiked higher at the end of the quarter. Growth stocks tend to underperform value stocks when US treasury yields are rising and outperform when they are falling, particularly when the move is relatively large and sudden. Figure 1 helps to illustrate this relationship.
Figure 1: 10-yr US Treasury Yields’ Late Quarter Spike Helped to Dent Growth Stocks

Source: Yahoo Finance (inclusive of dividends)
Next I dive into the major factors driving the market and my views of how it could all play out.
My Outlook
Upcoming legislation
President Biden and Democratic leadership continue to push for their signature legislation – a $3.5 trillion package of social safety net and climate change initiatives I will refer to as “human infrastructure”. However, two centrist Democratic senators – Joe Manchin of West Virginia and Krysten Sinema of Arizona – have stonewalled their efforts given their concerns over the size of the package and tax increases necessary to fund the spending. Democrats need both their votes in an evenly split Senate because of no Republican support. Vice President Kamala Harris would act as the tie-breaking vote.
Meanwhile, the $1 trillion physical infrastructure bill has bipartisan support but is being used as a bargaining chip by the progressive faction of the House of Representatives. House progressives are trying to tie passage of the infrastructure bill, which already cleared the Senate, to the full $3.5 trillion human infrastructure bill passing through a process called reconciliation.
It is highly uncertain whether moderate and progressive members of Congress can bridge their differences and bring these two bills to Biden’s desk for his signature. Manchin could be persuaded to voting yes to a $2.0 trillion human infrastructure bill, up from the $1.5 trillion figure he had been seeking, but Sinema’s demands are less clear and progressive House members may not tolerate a major gutting of the bill. I give 33% odds of the big spending package passing by year end and 50% odds for the traditional infrastructure bill.
I see moderate stock market implications should the larger legislation be signed into law. The sheer magnitude of spending, even if reduced to around $2 trillion, would likely fuel further inflation concerns and push 10-year treasury yields somewhat higher. Further, there could be an effort by high-income investors to accelerate harvesting of capital gains before tax rates go up. Both effects would likely negatively impact growth stocks to a greater extent than value stocks. Passage of the smaller infrastructure deal could also engender some inflation concerns, but higher taxes would not be a consideration since that is not part of the funding plan.
Covid-19
The dramatic resurgence of Covid-19 cases because of the highly transmissible Delta variant surprised most people, including yours truly. Indeed, Covid-19 cases in the US surged around 15-fold from their late June lows to early September highs, according to data compiled by the New York Times. The silver lining is that besides more people having some level of natural immunity, the seriousness of the situation (as well as growing employer vaccine mandates and other restrictions) spurred many of the previously unvaccinated to get vaccinated. Now, 56% of all Americans are fully vaccinated, including 65% of those 12 and up and 83% of people 65 and up.
Figure 2: New Reported Cases of Covid-19 through September 30

Source: New York Times. Updated 10/1/21. https://www.nytimes.com/interactive/2021/us/covid-cases.html
Like prior surges in the US and abroad, Covid-19 cases have begun a rapid decline approximately two months post-surge. I am cautiously optimistic that the latest surge will prove to be the last big one in the US because of a greater vaccinated population and rollout of booster shots that should minimize breakthrough cases. However, until vaccines are broadly inoculated across the world, there will continue to be human tragedy and all sorts of economic disruptions. To the extent that Covid concerns continue to ratchet down, I would expect a temporary resurgence in economic reopening areas of the stock market, particularly in travel-related companies.
Supply chain issues/inflation
Chief among the economic disruptions resulting from Covid-19 have been supply constraints. They have showed up on many fronts, from shut down manufacturing plants in Vietnam, to curtailed port capacity in China, to automotive chip shortages globally, and to a shortage of American port workers and truckers, to name a few. Supply chain issues have hamstrung a couple of our portfolio holdings too. I expect the supply chain issues will take time to resolve, perhaps not until next summer.
In the meantime, we will have to deal with dramatically higher than typical inflation because of the supply/demand mismatches in goods, and to a lesser extent, in services, due to labor inflation. This should constrain revenues across many industries, as well as lead to some margin pressure for companies that lack the pricing power to pass along higher costs to end customers. I believe that high inflation will prove transient, as the Federal Reserve expects, but the definition of transient likely needs to elongate from 6-9 months to 9-15 months.
Figure 3: Inflation Spike Is Unlikely to Abate in the Near-Term

Source: FRED citing the U.S. Bureau of Economic Analysis
The Federal Reserve/10-year treasury yields
All indications point to the Federal Reserve soon starting to reverse its highly accommodate monetary policies. During its September 21-22 FOMC meeting, the Fed acknowledged higher-than-desired inflation should persist longer than previously expected, while also stating indicators of economic activity and employment have continued to strengthen. During testimony following the meeting, Fed Chairman Jerome Powell suggested they will announce a beginning of tapering their $120 billion of monthly Treasury and mortgage-backed security purchases during their next policy meeting on November 2-3, as long as the September employment report does not disappoint.
I expect the Fed to follow through with tapering, but the Fed’s easy money policies are likely to persist for some time. I expect the tapering to take at least six months to wind down. It is not until then that the Fed would consider raising their benchmark overnight lending rate from 0.0%-0.25%, where it has been since March 2020. The Fed’s most recent dot plot showed nine of the 18 FOMC members expecting a rate hike in 2022, up from seven members at their June meeting. I expect one or two rate hikes next year, but a 0.5-0.75% Fed funds rate is still historically low.
Fed policy’s implications on the influential 10-year treasury yield are not one-for-one. Yes, the 10-year treasury yield spiked at the end of the third quarter because of the Fed’s slightly more hawkish tone. However, a more proactive Fed could prevent high inflation from becoming entrenched in the intermediate- to long-run, ultimately necessitating fewer Fed rate hikes.
I expect rising 1- to 3-year treasury yields as Fed rate hikes draw nearer, but 10-year treasury yields should remain constrained below 2% if the full $3.5 trillion human infrastructure bill does not pass. This is contrary to consensus opinion that 10-year treasury yields are destined to pierce through 2%. If yields stay below 2%, then equity valuations should be well-supported, especially growth stocks.
Client Positioning
I take a long-term view that focuses on compounding returns in a tax-efficient manner. You will not see me make dramatic asset allocation changes based on my views of legislation, Fed policy, or other factors. Further, I allocate the bulk of my clients’ equity positions in “quality growth” names that have strong and sustainable competitive advantages, above-average long-term growth prospects, high levels of profitability and free cash flows, and prudent levels of debt. I believe this investment philosophy affords my clients the best shot of generating maximum after-tax, risk-adjusted returns compounded over the long run.
Indeed, I continue to invest around 80% of clients’ equity allocations in companies I would characterize as “quality growth.” The remainder of clients’ portfolios continue to be invested in a mix of low- to medium- quality, highly cyclical companies that should more fully benefit from an ongoing economic reopening. Many of our quality growth companies have above-average cyclicality, so they stand to disproportionately benefit from a resurgent economy too. Overall, clients should expect their equity portfolio to do best versus the market when growth outperforms value and 10-year treasury yields remain tame.
Figure 4: Portfolio Changes in Majority of Client Accounts in 3Q 2021

Source: Glass Lake Wealth Management
Portfolio changes in the third quarter had the net effect of slightly reducing cyclicality. I anticipate further paring down the cyclical exposure in client portfolios once economies more fully reopen (again) to attain fuller portfolio harmony with my investment philosophy. All the while, you are highly unlikely to see me dabble in the most speculative areas of the market, such as investing in electric vehicle, space exploration, Reddit-fueled meme stocks, or SPACs because I believe their stock prices remain divorced from their economic realities. As always, I will keep an open mind and be on the hunt for the next great long-term investment.
I hope you and your loved ones stay happy, healthy, and wealthy.
Sincerely,

Jim Krapfel, CFA, CFP
Founder/President
Glass Lake Wealth Management, LLC
glasslakewealth.com
608-347-5558
Stock Feature
PayPal’s Strong Network Effects are Expanding Beyond E-Commerce
This is the second newsletter featuring a brief writeup of a holding or new purchase that outlines my investment case for the company. First was MSCI; next up is PayPal.
I first started buying PayPal shares for myself in July 2017 and I have consistently purchased it as a top-two holding since I started onboarding clients in April 2020. It was the second largest aggregate stock position across client accounts as of September 30.
Company Description/Economic Moat
Since PayPal Holdings’ (ticker PYPL) spinoff from eBay (ticker EBAY) in July 2015, PayPal’s core business has been, and will continue to be, its two-sided payment platform that serves merchants and consumers. For consumers, PayPal offers a convenient and secure online/mobile checkout experience by not having to manually input card information. For merchants, the easy consumer checkout experience improves sales conversion from online shopping carts, as well as provides insights on fraud, risk management, and customer activity.
PayPal’s economic moat, or sustainable competitive advantage, largely stems from its growing network effects. The company enjoys a virtuous cycle of consumers increasingly using PayPal to transact online, which prompts online merchants to increasingly accept PayPal as a payment method, which drives more consumers to use the service. Per a recent Morgan Stanley research report[1], PayPal was accepted as a payment method by 79% of the top 500 US online merchants, 5.5x greater than the next largest cross-hardware platform digital wallet.
PayPal derived 93% of its 2020 revenue from related transaction revenue. Including peer-to-peer money transfer app Venmo, which PayPal has only begun monetizing, the company earned a 1.86% revenue take rate on all transactions that flowed through its networks during its most recently reported quarter. PayPal shares the transaction economics with the card payment networks (Visa, Mastercard, American Express, Discover) when it is funded with a debit or credit card stored on users’ PayPal accounts. PayPal earns much better gross margins when consumers fund their purchases with their PayPal account balances.
PayPal is morphing from an e-commerce facilitator to a super app. Through acquisitions over the years and organic development, PayPal also offers services such as global remittances (introduced in 2015), Pay With Venmo (2016), physical payment terminals (2018), in-person QR code checkout (May 2020), Buy Now Pay Later (August 2020), and cryptocurrency transacting (October 2020). It is in the process of launching a new digital wallet that will include a high yield savings account, bill pay functionality, messaging, crypto, deals, and offers. The company is also exploring a stock-trading platform for US users, according to CNBC.
Having so much functionality in one place should strengthen the customer relationship and make it less likely for a customer to transact through other means, thus deepening its economic moat.
Growth, Profitability & Valuation
PayPal exhibits a strong and accelerated growth profile. As depicted in Figure 4, cumulative average growth rates for revenue, adjusted operating income, and adjusted EPS over the past four years were 19%, 25%, and 27%, respectively. Revenue growth decelerated by three percentage points to 15% in 2019, but growth reaccelerated shortly after the onset of the Covid-19 pandemic. Indeed, currency-adjusted revenue growth accelerated to an average of 24% over the past five quarters as people moved more of their shopping online.
All indications are that PayPal will be able to sustain underlying growth rates higher than what it achieved prior to the pandemic. Excluding customer eBay, PayPal’s total payment volume growth accelerated to 47% in the first half of 2021 from 40% in the fourth quarter of 2020. Strong momentum can also be seen in important operating metrics such as merchant signups and customer engagement. Further, a big, first-in-20-years price increase went into effect in August, which should boost PayPal’s revenue take rate and is indicative of its pricing power in the marketplace.
Figure 5: PayPal’s Growth and Profitability Metrics Inflecting Upwards
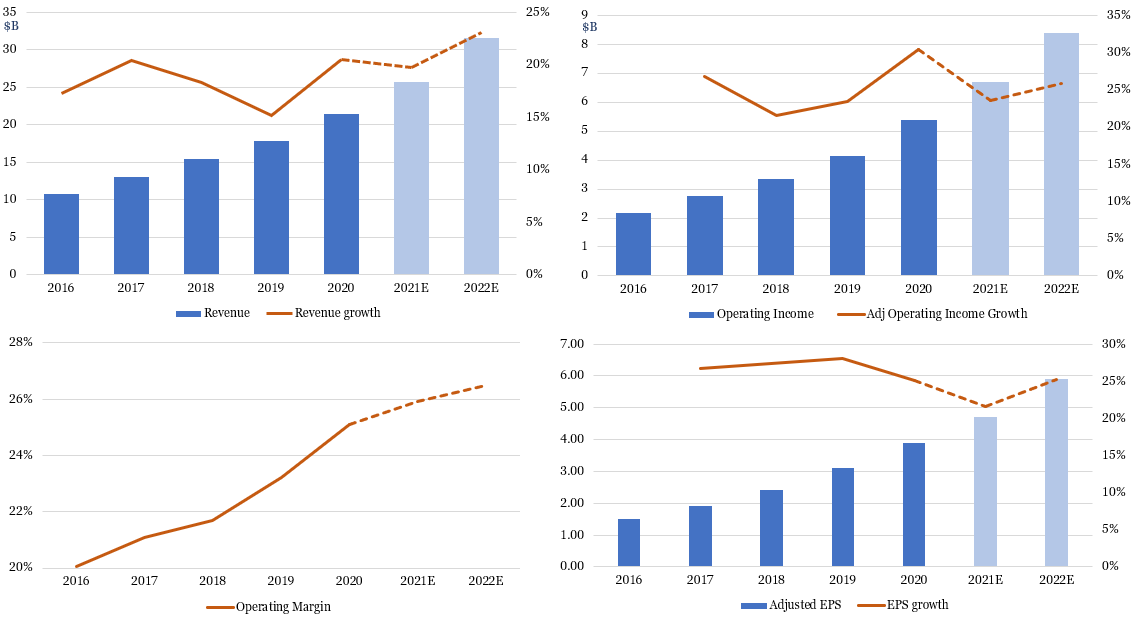
Source: Company filings (historical results), Koyfin (analysts’ consensus estimates)
Worth mentioning is that PayPal is navigating through eBay’s faster than expected transition to utilizing alternative (to PayPal) payment options on its service. This should shave about seven percentage points off PayPal’s revenue growth rate in 2021 and two to three percentage points in 2022. I consider this event to be a unique, non-recurring event. eBay, 13% of revenue in 2020 versus 26% at the time of its spinoff, will influence PayPal’s growth rates much less going forward and revenue is unlikely to go to zero.
eBay’s effects fully explain PayPal’s guidance for 2021 revenue in constant currency to grow by 18.5%, a deceleration from 22% growth in 2020. PayPal expects growth to reaccelerate in 2022 as the eBay effects lessen and its underlying business continues to grow by at least 20%. Perhaps more telling of the company’s bright long-term future are its five-year growth targets the company laid out in February. This includes a 20% cumulative average growth rate (CAGR) for revenue, above the 17-18% five-year outlook previously issued in May 2018.
It gets even better with PayPal’s track record of increasing margins. Its operating margins have expanded by five percentage points in four years and PayPal expects margins to continue to expand over the next five years. This equates to a 27% EPS CAGR earned over the past four years and a company target of 22% annual growth over the next five. I expect their EPS growth target to be surpassed because PayPal operates a highly scalable business model that allows for aggressive reinvestment in the business and expansion of margins at the same time.
The company’s strengthening competitive position and accelerated long-term growth profile are certainly not lost by the market. The company trades for 51x next 12 months consensus earnings, according to Koyfin, well above the 32x it traded for two years ago and 22x for the S&P 500. Still, I believe the quality (20% free cash flow margins) and earnings growth sustainability make this premium well-deserved. I expect long-term shareholders to be rewarded and I expect the stock will remain a top holding for years to come.
At the same time, I am not wed to any stock. What would cause me to rethink my bullish positioning would be signs that other pay buttons, such as Apple Pay, take market share from PayPal. Further, an acquisition spending spree and/or margin-destructive investments with no growth acceleration would be cause for concern.
[1] Morgan Stanley. “PayPal Holdings, Inc.: More Volumes, Users, and Frequency; Remain OW”. Published 7/22/20.
Retirement Planning
Delaying Social Security Benefits Is Often the Best Choice for 60-Somethings
One of the biggest financial decisions to make in one’s lifetime is when to claim Social Security benefits. The present value of future payments can easily exceed $1 million for married couples, so it pays to get it right, particularly because the decision is irreversible. However, it appears too many are claiming too early. Indeed, year-in, year-out, over 60% of all eligible workers claimed benefits prior to reaching Social Security’s definition of “full retirement age.” In this financial planning article, I explain why waiting to claim until at least full retirement age is often the best choice for a healthy single person and a higher-earning married person.
Overview of Social Security
The Social Security Act was signed into law by President Roosevelt in 1935. It created a social insurance program designed to pay retired workers a continuing income after retirement. The specifics have changed over the years, but the basic concept -- setting aside a portion of workers’ pay to fund older Americans’ retirement -- has endured. Employers and employees each pay 6.2% of wages up to the earnings taxation limit, set at $142,800 in 2021, while the self-employed pay the full 12.4% up to the earnings taxation limit.
One may begin collecting Social Security benefits any time between ages 62 and 70, provided there are at least 10 years of work. The monthly payment amount depends on three factors – (1) how much income has been subject to the Social Security payroll tax, which determines one’s “primary insurance amount” (PIA); (2) age at first claiming one’s Social Security benefits; and (3) an inflation measure called “cost-of-living adjustment” (COLA). I go through each of these determinates separately.
Figure 6: Three Determinants of Social Security Payment Amount

Social Security Payment Determinant #1: Primary Insurance Amount (PIA)
The PIA represents the monthly payments one can lock in at “full retirement age” (FRA). FRA was considered age 66 or younger for people born in 1954 or earlier, and it increases by 2 months each year until age 67 for people born in 1960 or later. Today, FRA is 66 years, 2 months.
The PIA is based off the “average indexed (inflation-adjusted) monthly earnings” (AIME) over the 35 highest income years, up to each year’s earnings taxation cap. If less than 35 years were worked, then years without work count as 0 and reduce the benefit amount. The calculation of PIA is as follows:
90% for the first $996 of monthly wage income (to $11,952 annualized income) +
32% for the next $5,006 (to $72,024 annualized income) +
15% for the next $5,898 (to $142,800 annualized income)
Figure 7: Annualized PIA Increases at a Decelerating Rate to AIME, to a ~$40k Cap

Source: Social Security Administration. https://www.ssa.gov/oact/cola/piaformula.html
Figure 7 illustrates the means-tested nature of Social Security. The income replacement rate, or the percentage of income during one’s working years that is replaced by Social Security benefits at retirement, quickly declines as average income rises. The effective income replacement rate declines from 90% for someone with $10,000 of average annual income, to 41% for $75,000 income and to 30% for $125,000 income.
Because of the cap on annual earnings subject to the Social Security payroll tax (and figured into the PIA equation), the theoretical maximum PIA one could have in 2021 is $3,383, equivalent to $40,596 for a full year. In reality, it is somewhat lower because the earnings limit on which one pays Social Security taxes each year has risen faster than inflationary benefit increases.
Social Security Payment Determinant #2: Age at First Claim
Again, the PIA amount specifies how much Social Security monthly benefit would be received if claiming at FRA. Naturally, if benefits are first claimed prior to FRA, then the benefit is reduced, and on a permanent basis. Specifically, benefits reduce as follows:
First 36 months prior to FRA: reduction of 5/9 of 1% for each month before FRA; and
Months beyond 36 months prior to FRA: reduction of 5/12 of 1%
More simply, the monthly benefit declines by 6.67% per year for the three nearest years to FRA, and by 5% per year prior to that. For example, if Susan’s FRA is 67 and she started taking benefits four years prior at age 63, then her reduction in benefits would be (3 years X 6.67%) + (1 year X 5%) = 25%.
Conversely, if benefits are first claimed after FRA, then the permanent monthly benefit increases. Here the calculation is a bit simpler, with monthly benefits increased by 8% for each year benefits were first claimed beyond FRA. For example, if Mark’s FRA is 66 years, 6 months and he started taking benefits three and a half years after at age 70, then his monthly benefits would be enhanced by 28% (3.5 years X 8%).
Figure 8 shows how monthly benefits increase when benefits are delayed, in this case for someone with a PIA of $3,000 and an FRA of 67.
Figure 8: Monthly Retirement Benefits for Someone with a PIA of $3,000 and FRA of 67

Source: Social Security Administration. https://www.ssa.gov/OACT/COLA/Benefits.html
Social Security Payment Determinant #3: Cost-of-Living Adjustment (COLA)
The third determinant of monthly benefit amount is an inflation measure Social Security terms “cost-of-living adjustment” (COLA). COLA factors into both the calculation of the highest 35 years of income (indexed to inflation each year, as mentioned earlier), as well as calculating future year benefits. Through this adjustment, benefits typically increase each year to keep up with inflation. The most recent adjustment was 1.3% effective January 2021, but some anticipate a 6% increase in 2022 due to high inflation this year, a nice boost to current retirees’ benefits (though neutral on an inflation-adjusted basis!).
When It Makes Sense to Wait to Claim Social Security
Single People
For single people, determining when to claim Social Security benefits is a relatively straightforward exercise. It comes down to three factors – life expectancy, inflation, and investment returns, when applicable. Social Security breakeven analyses often consider just life expectancy, but the rate at which benefits grow via inflation and how well invested Social Security proceeds perform (or how well an existing portfolio that no longer needs to be sold down, performs) are important factors in economic outcomes.
Put simply, the longer the life expectancy, the higher the expected inflation, and the lower the expected investment returns, the more advantageous it becomes to wait as long as possible before claiming benefits. Conversely, if life expectancy is relatively short, inflation expectations are muted and perceived investment returns are high, then claiming early becomes more attractive.
Delaying benefits will (obviously) have negative economic effects for the first several years because one is not receiving any benefits. The question is at what age must a person reach to be economically better off by delaying their benefits claim and thus receive permanently higher monthly payments? This “breakeven” age depends on inflation and expected investment returns.
Let us look at three inflation and investment return scenarios of a 62-year-old considering whether to take Social Security benefits now or wait until her FRA at age 67. As seen on Figure 9, the low inflation, high return scenario (blue line) carries the longest breakeven period. Meanwhile, the breakeven period is shortened significantly in the depicted high inflation, low return environment (orange line). The breakeven period is curtailed further in the third scenario that entails needing to live off Social Security and not having an investment portfolio that would otherwise have to be sold down to pay for living expenses (gray line).
Figure 9: Cumulative Economic Value of Delayed Claim to Age 67 FRA from 62

Source: Glass Lake Wealth Management analysis
Although one may start claiming Social Security at any point from ages 62 to 70, further reevaluation is warranted upon reaching FRA. Figure 10 uses the same hypothetical inflation and investment return scenarios but this time for a 67-year old at FRA who decides whether to delay all the way to age 70. This delay decision carries longer breakeven points at ages 87, 82, and 79, respectively, versus 85, 78, and 76 in the prior example.
Figure 10: Cumulative Economic Value of Delayed Claim to Age 70 from 67 FRA

Source: Glass Lake Wealth Management analysis
How might the person with average health proceed? A good starting point is to look at average life expectancy. According to Social Security’s period life table for 2019, a 62-year-old man is expected to live to 82, a 62-year old woman to 85, a 67-year-old man to 83, and a 67-year-old woman to 86. These dates augur for waiting to claim until FRA besides those who are particularly bullish on the markets and sanguine on inflation. Waiting to claim to age 70 often makes sense too, but it requires a rosier view of one’s longevity than deciding to wait for FRA.
Married People
For married couples, the calculus changes a bit. A married person can choose to (1) take one’s own benefits, per usual; (2) take a “spousal benefit” while his or her spouse is still alive; or (3) take or a “survivor benefit” when his or her spouse dies. One can switch to whichever provides the greatest benefit, but only one benefit can be taken at a time.
The spousal benefit works by allowing one spouse to take a benefit (who we will call “receiving spouse”) based on their living spouse’s (who we will call “worker spouse”) PIA. The receiving spouse may receive up to 50% of the worker’s PIA benefit provided benefits are first claimed at the receiving spouse’s FRA. Claiming the spousal benefit before FRA carries a high penalty as the benefit amount can reduced by up to 35%. Unlike taking one’s own benefits, there is no enhanced benefit for waiting to claim beyond FRA.
Importantly, a receiving spouse cannot claim spousal benefits until the worker spouse claims his or her own Social Security benefit. The receiving spouse must also be at least 62 years old and the marriage duration must have reached at least one year.
After one spouse dies, the surviving spouse may be entitled to survivor benefits. The surviving spouse needs to be 60 years old to claim benefits with a marriage that lasted at least nine months. If the surviving spouse claims the benefit at FRA or later, he or she is entitled to 100% of the benefit the decedent spouse would have received, but the benefit is reduced by up to 28.5% if the surviving spouse claims early.
Since the survivor benefit is derived from the amount the deceased spouse would have received, the deceased spouse’s timing of taking benefits impacts the amount of benefits for a surviving spouse. There is a greater survivor benefit each year that the deceased spouse delays taking benefits from ages 62 to 70.
Often the most optimal claiming strategy has the higher earning spouse waiting to collect, and the lower earning spouse collecting first. This strategy is especially beneficial if the higher earning spouse has a PIA over double the lower earning spouse. At the time the higher earning spouse claims benefits at FRA or later, the lower earning spouse automatically switches over to the more substantial spousal benefit through a process called “deemed filing.” If the higher earning spouse dies first, the surviving spouse may switch again to the survivor benefit, which pays at least twice as much as the spousal benefit.
If both spouses are highly confident in living beyond their respective breakeven points and benefits are not needed to maintain their lifestyle, then both may choose to delay benefits to age 70. Conversely, it could make sense for both spouses to claim benefits at age 62 if they are both unhealthy.
Bottom Line
For most single people, waiting to claim Social Security benefits until at least full retirement age is the smart move because of the likelihood of living beyond the economic breakeven age and the reduction of longevity risk – the risk of outliving savings. Waiting to claim is typically the best strategy for the higher earning spouse as well due to enhanced spousal and survivor benefits to the other spouse.
There are exceptions to the rule, of course. Claimants who expect to live a shorter than average life or are financially constrained might do better with, or be forced into, a younger claiming age. Further, those who are particularly optimistic about their ability to generate real returns – their investment returns minus inflation – ought to take the money early and invest it.
There is a myriad of other considerations not covered here, such as those that apply to claimants who are still working, have child dependents, are divorcees, or are disabled or have disabled family members. As such, it is best to consult with a Social Security expert before making this important, irreversible decision.
Disclaimer
Advisory services are offered by Glass Lake Wealth Management LLC, a Registered Investment Advisor in the State of Illinois. Glass Lake is an investments-oriented boutique that offers a full spectrum of wealth management advice.
The investment letter expresses the views of the author as of the date indicated and such views are subject to change without notice. Glass Lake has no duty or obligation to update the information contained herein. Further, Glass Lake makes no representation, and it should not be assumed, that past investment performance is an indication of future results. Moreover, whenever there is the potential for profit there is also the possibility of loss.
The investment letter and financial planning article are being made available for educational purposes only and should not be used for any other purpose. The information contained herein does not constitute and should not be construed as an offering of advisory, legal, or accounting services or an offer to sell or solicitation to buy any securities or related financial instruments in any jurisdiction. Certain information contained herein concerning economic trends or market statistics is based on or derived from information provided by independent third-party sources. Glass Lake Wealth Management believes that the sources from which such information has been obtained are reliable; however, it cannot guarantee the accuracy of such information and has not independently verified the accuracy or completeness of such information or the assumptions in which such information is based.