July 2021 Newsletter
Table of Contents
Investment Management – 2Q 2021 Investment Letter
Stock Feature — “Competitively Advantaged Indexer MSCI Rides Big ESG Tailwinds”
Tax Planning – “The Great Migration — Which States Make for a Tax-Smart Move”
Disclaimer
Investment Management
2Q 2021 Investment Letter
Glass Lake Clients and Prospects:
Conditions for a continuation of the bull run in stock markets were in place over the past quarter. Most importantly, the United States found itself in a much better situation with Covid-19 than three months ago. The proportion of Americans who were fully vaccinated reached 47% on June 28, and 55% had received at least one dose. The better inoculated population pushed the 7-day average of newly reported cases to approximately 12,000, down 81% from the end of March and off 95% from the January peak.
The dramatic decline in Covid-19 infections allowed governments to fully reopen their economies sooner than expected. An earlier reopening, alongside nearly $6 trillion of pandemic government stimulus and strong consumer balance sheets, drove a surge of economic activity. Recent economic indicators were robust almost across the board, from consumer confidence (which zoomed to a pandemic high in June) to IHS Markit US Composite PMI (which measures services and manufacturing output and hit record levels in May).
The only notable area of disappointment was in non-farm payrolls for May, which was likely driven by a combination of enhanced unemployment benefits that pay many people more not to work, lingering Covid-19 apprehension, and childcare constraints. Less-than-robust hiring was certainly not due to a worker demand shortage, as job openings reached 9.3 million in April, a record high dating back to the survey’s onset in 2000.
The hot economy, in concert with global supply constraints, drove inflation to the forefront of investors’ concerns. Indeed, PCE inflation, the Federal Reserve’s preferred measure of inflation, spiked to levels not seen since 2008, as shown in Figure 1. The recent spike was more dramatic than the Fed anticipated, and much greater than its target of 2% average inflation, but the Fed steadfastly believes high inflation will prove transitory.
Figure 1: Inflation Is On the Rise
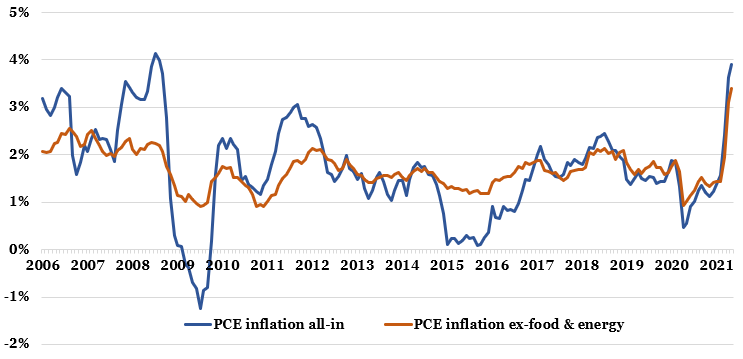
Source: FRED citing the U.S. Bureau of Economic Analysis
The bond market appears to be siding with the Fed instead of worried market pontificators. Rather than a march towards 2%, as had become the consensus, the influential 10-year treasury yield shrugged off hotter-than-expected inflation and instead turned lower. The bond market did not even fret in reaction to an incrementally more hawkish Fed when it concluded its two-day meeting on June 16. Fed meeting participants now expect a median of two rate hikes by the end of 2023 versus none at its March meeting, and it begun discussion about how it will signal an eventual tapering of its $40 billion and $80 billion of monthly mortgage bond and Treasury debt purchases. The Fed’s purchases help to keep mortgage rates and treasury yields low.
Figure 2: 10-Year Treasury Yield Reversed Course in Q2
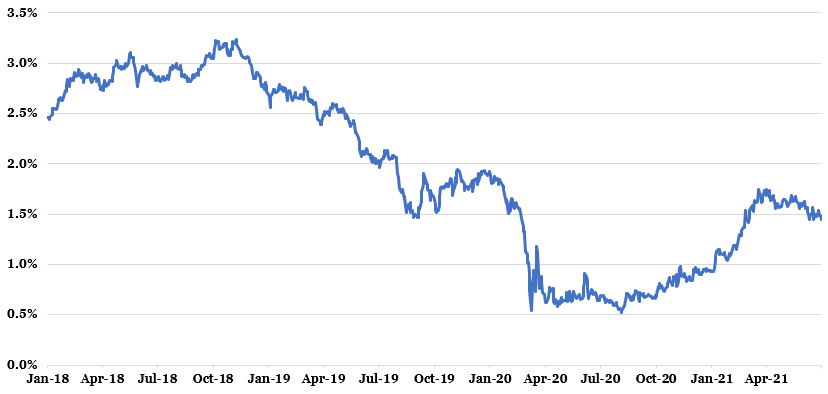
Source: U.S. Department of Treasury
Constrained treasury yields flipped the script of what had been working in the market. Whereas pro-cyclical sectors such as energy, materials, and financials led the pack in the first quarter, the market rotated back to more growthy equities such those in the technology sector. Indeed, the Russell 1000 Growth ETF (ticker IWF) outperformed the Russell 1000 Value ETF (ticker IWD), 11.8% to 5.0%, in the second quarter. The overall market, as measured by the Russell 3000 ETF (ticker IWV), rose 8.1%, bringing its year-to-date gain to 15.1%.
Figure 3: Growth Staged a Comeback in Q2
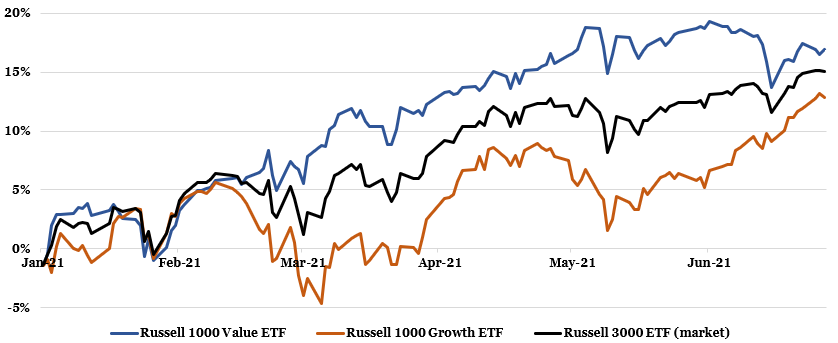
Source: Yahoo Finance
My Outlook
Upcoming legislation
President Biden and most Democrats hope to go big with their progressive agenda now that they control both the House and Senate, albeit by razor thin margins. However, a multi-trillion “human infrastructure” package will require persuading centrist democratic senators Joe Manchin of West Virginia and Krysten Sinema of Arizona to pass legislation with a simple majority vote via reconciliation instead of the 60-vote requirement to avoid a filibuster. Certainly, no Republican will support any bill that requires higher taxes to fund it.
Meanwhile, a much smaller traditional infrastructure bill, with $579 billion of incremental spending over five or more years, has some bipartisan backing but is no lock. I give 60% odds that a traditional infrastructure bill passes but remain skeptical that more ambitious legislation is signed into law before midterm elections in 2022.
Whereas passage of a smaller infrastructure deal would probably mean little to the stock market, a multi-trillion package could easily lead to more worries over an overheated economy, driving treasury yields higher and acting as a headwind to growth stocks. There would also likely be major consternation among households earning over $400,000 who would face material tax hikes, resulting in a need for timely tax planning that could involve accelerated harvesting of investment gains before tax rates go up.
The Federal Reserve
The Fed is unlikely to raise its overnight federal-funds rate target for some time despite its recent indication it could move a bit sooner to tighten monetary policy. Only 7 of 18 Fed officials believe the Fed will raise rates by the end of 2022, and 5 believe that it will not incur until at least 2024.
I agree with Fed Chairman Jerome Powell’s view that the inflation spike will not prove to be terribly persistent as pandemic-driven global supply constraints eventually resolve themselves and structural inflation suppressants, such as an aging population and technological advances, continue to play out. Unexpected passage of a multi-trillion human infrastructure package could change my view though.
10-year treasury yields
My baseline expectation is for the 10-year treasury yield to work back towards its year-to-date high in the 1.75% range as near-term inflation could surprise to the upside and as the bond market better anticipates the Fed becoming less accommodative. I see roughly equal likelihood between yields piercing 2% later this year and yields remaining just under 1.5%.
Covid-19
Despite concerns surrounding the far more transmittable Delta variant, I do not expect a dramatic resurgence of Covid cases nationally because available vaccines have proven to be highly effective against the variant. Rather, I expect there will be localized outbreaks in less-vaccinated pockets of the country. Upcoming vaccine approval for younger children should get our country closer to herd immunity too. The great American economic reopening shall continue.
Stock market
I expect the market to slow its ascent but generally drift higher over the back half of the year. An ongoing economic reopening and release of pent-up consumer demand should act as tailwinds to companies’ revenue but inflationary pressures in wages, materials, and freight, along with resumed corporate travel and company investments post-pandemic, could pressure margins and constrain earnings growth and free cash flow generation. Fluctuating interest rates will also have ramifications for valuations.
Which classification of stocks outperform largely boils down to inflation, treasury yields and prospects for global growth. If inflation percolates further, driving 10-year treasury yields towards 2%, then I would expect cyclical and value stocks to perform relatively well. By contrast, if declining commodity costs signal that high inflation proves to be transitory, allowing the Fed to maintain its highly accommodative monetary policy, then growth stocks should lead. I do not have a strong opinion on which will do better in the near-term.
Client Positioning
I take a long-term view that focuses on compounding returns in a tax-efficient manner. You will not see me make dramatic asset allocation changes based on my views of Fed policy, legislation, or other factors. Further, I allocate the bulk of my clients’ equity positions in “quality growth” names that have strong and sustainable competitive advantages, above-average long-term growth prospects, high levels of profitability and free cash flows, and prudent levels of debt. I believe this investment philosophy affords my clients the best shot of generating maximum after-tax, risk-adjusted returns compounded over the long run.
Indeed, I continue to invest over 80% of clients’ equity allocations in companies I would characterize as quality growth. The remainder of clients’ portfolios continue to be invested in lower quality, highly cyclical companies that should more fully benefit from an ongoing economic reopening. Many of our “quality growth” companies have above-average cyclicality, so they stand to disproportionately benefit from a resurgent economy too. Overall, clients should expect their equity portfolio to do best versus the market when growth outperforms value.
Figure 4: Portfolio Changes in Majority of Client Accounts in 2Q 2021
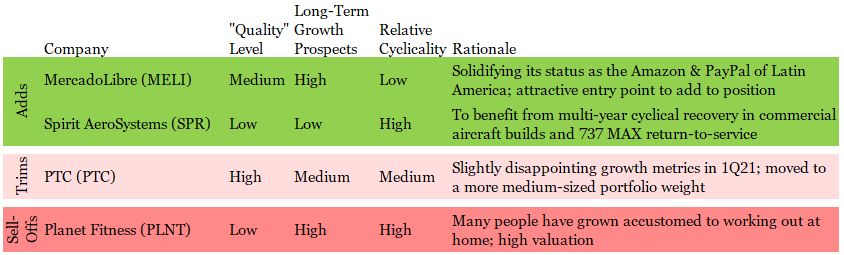
I anticipate paring down the cyclical exposure in client portfolios over the next 6-12 months to attain fuller portfolio harmony with my investment philosophy. All the while, you are highly unlikely to see me dabble in the most speculative areas of the market, such as investing in electric vehicle, space exploration, Reddit-fueled meme stocks, or SPACs because I believe their stock prices remain divorced from their fundamental realities. As always, I will keep an open mind and be on the hunt for the next great long-term investment.
I hope you and your loved ones stay happy, healthy, and wealthy. Enjoy your 4th of July weekend and summer!
Sincerely,

Jim Krapfel, CFA, CFP
Founder/President
Glass Lake Wealth Management, LLC
glasslakewealth.com
608-347-5558
Stock Feature
Competitively Advantaged Indexer MSCI Rides Big ESG Tailwinds
Several readers said they would be interested to learn about some of their holdings. Starting with this publication, each newsletter will include a brief writeup of a holding or new purchase that outlines my investment case for the company. First up is MSCI.
My history with MSCI goes back to September 2017, when I first started buying shares for myself. It has been consistently purchased as a top-two holding since I started onboarding clients in April 2020 and it was the largest aggregate stock position across client accounts as of June 30.
Company Description/Economic Moat
MSCI, Inc. (ticker MSCI) provides analysis, data, and ratings to support the needs of asset managers throughout their investment process. Its most well-known products are its flagship indexes, including MSCI All Country World Index (ticker ACWI), MSCI Emerging Markets (ticker EEM), and MSCI Europe, Australiasia, Far East (ticker EFA).
The Index segment of the company made up 60% of its revenue and 79% of adjusted EBITDA in 2020. The segment is split roughly 60/40 between recurring subscriptions and asset-based fees. Subscription revenues arise from licensing its indexes to active managers for benchmarking purposes. Its economic moat, or sustainable competitive advantage, is strong because pension funds and endowments seek to evaluate active managers’ performance and risk attributes on an apples-to-apples basis, and MSCI is the industry standard. Further, these gatekeepers of substantial capital do not have a profit motive to switch to cheaper or free benchmark providers.
The other way MSCI monetizes its indexes is by licensing them to exchange traded fund (ETF) providers like Blackrock, Inc. (ticker BLK; source of 11% of total revenue) so they can create ETFs that mirror MSCI’s indexes. MSCI earns a weighted average of 2.6 basis points (0.0026%) on ETFs that use its indexes, with the aforementioned flagship ETFs commanding higher fees and newer ETFs lower fees. MSCI is well-entrenched here as well, having extended its long-time partnership with BlackRock in 2019 through 2030. The strong moat of the index business in its entirety is well-evidenced by the segment’s 75.4% adjusted EBITDA margins and revenue retention rate consistently near 95%.
MSCI is also the leading player in environmental, social, and governance (ESG) and climate indexes upon which ETF providers license, as well as ESG and climate ratings data sold to asset managers, consultants, and advisers. Total ESG revenues, which reside in its Index segment and ESG & Climate segments, was 13% of revenue in its latest quarter. As society becomes increasingly environmentally and socially conscious, more pressure is being put on companies to be better corporate citizens or risk being uninvestable to a larger swath of investors.
Finally, MSCI’s analytics business, 30% of 2020 revenue, helps institutional investors obtain a better view of risk and return. Like its index business, revenue is sticky as it sports a revenue retention ratio in the low- to mid-90s, but it is not as competitively dominant as the segment’s 34% adjusted EBITDA margins suggest (though still quite strong on an absolute basis).
Growth, Profitability & Valuation
MSCI exhibits a consistently strong growth profile. As depicted in Figure 5, cumulative average growth rates for revenue, adjusted EBITDA, and adjusted EPS over the past five years were 9.5%, 15.1%, and 27.5%, respectively. Further, return on invested capital (ROIC), an important metric that determines whether a company is creating shareholder value, jumped to 26% in 2020 from 11% in 2015, well above its cost of capital in the 6-8% range.
Figure 5: MSCI Exhibits Consistent Growth and Profitability Metrics
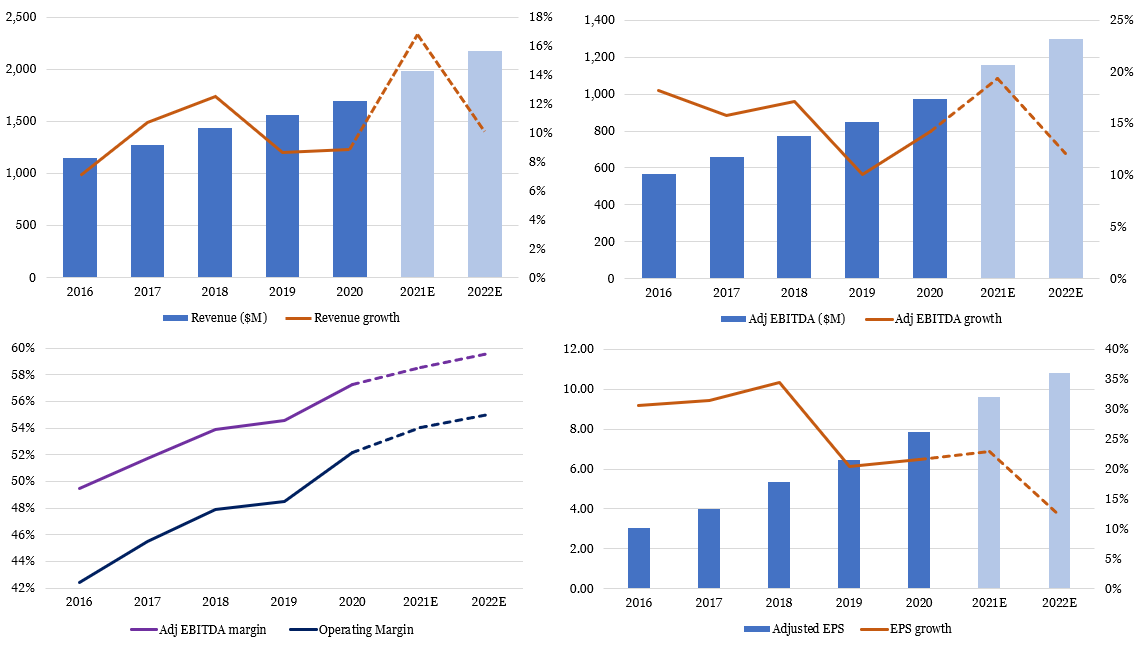
Source: Company filings (historical results), Koyfin (analysts’ consensus estimates)
There is good reason to believe its strong business momentum will continue for the foreseeable future. As long as asset prices remain well-supported, its asset manager customers should continue to use MSCI for benchmarking purposes. Meanwhile, a decades-long shift from active to passive management should drive continued flows to ETFs onto which MSCI earns asset-based fees. Finally, increased corporate scrutiny on ESG and climate factors should drive investment dollars to MSCI-linked ETFs and to MSCI’s ESG research in general.
Management updated their long-term operating model in February to reflect low-double-digit revenue growth (unchanged from their 2019 model) and low- to mid-teens adjusted EBITDA growth (versus mid-teens in 2019). This reflects low-double-digit revenue growth in the Index segment, mid- to high-20s revenue growth in the ESG & Climate segment, and high-single-digit revenue growth in the Analytics segment. Unless equity markets falter, I expect MSCI to outperform these figures given its track record of outperformance to management and analyst expectations, and because ESG investing appears to have reached a major inflection point.
The stock market has afforded the company a premium valuation, equal to 55x estimated 2021 EPS and 49x estimated 2022 EPS, owing to the company’s steady execution and better investor recognition of the firm’s strong fundamental outlook, especially as it pertains to ESG. Given MSCI’s strong, sustainable competitive advantages and long runway for growth, I anticipate holding the stock for many more years.
Other than periodic trims because of excessive valuation or to keep position sizing in check, I would consider selling the stock because either: (1) there is evidence that asset managers have moved to self-indexing in force; (2) Blackrock intends to move away from MSCI as an index provider and/or commands substantial fee reductions; or (3) MSCI’s ESG leadership is supplanted by another service provider. To be sure, I do not see any reason to be immediately concerned, but I will remain vigilant in identifying how my bullish thesis could be dispelled.
Tax Planning
The Great Migration — Which States Make for a Tax-Smart Move
One of the many revelations stemming from the Covid-19 pandemic was that normally office-bound employees can be highly productive working from home. While most employers are offering hybrid work arrangements, others are allowing employees to fully work from home. Indeed, big companies such as Amgen, Capital One, Facebook, Pinterest, Salesforce, Snowflake, Square, Twitter, and Zillow have announced post-pandemic policies that give a sizeable portion of their respective workforces the option of where they would like to work.
The growing number of work-from-home employees, unconstrained by proximity to the company office, has driven a “great migration” away from expensive cities and states to more affordable areas. Taxes figure prominently into the cost-of-living equation, so in this financial planning article I examine each state’s tax regime to see which offer the best tax-smart move. The overall rankings might not surprise you, but there is considerable nuance depending on a household’s financial situation and life stage.
Methodology
I focused on state and local income taxes, property taxes, and sales taxes because these are the big three tax buckets people pay into at the state and local level. Income taxes were applied at prevailing states’ rates after standard deductions and exemptions, with average county and city taxes added in for the 10 states that have these taxes (AL, IA, IN, KY, MD, MI, MO, NY, OH, PA). Notably, New York City’s income tax rates range from 3.078% to 3.876%, but I have only incorporated the 1.47% average state-wide city tax into my analysis.
Meanwhile, property tax rates were applied at the average state level. Of course, counties and cities within each state can have vastly different property tax levies. Finally, sales taxes were applied on a weighted-average basis across each state. Here again, different counties and cities will have varying tax rates. To keep the analysis from becoming overly complex, I have ignored states’ different policies on taxing things such as gasoline, groceries, alcohol, and capital gains.
I looked at five hypothetical affluent households that are representative of my typical client and prospect profile to better gauge states’ total taxation. The households are meant to capture how varying income, spending, home values, and marital status can make certain states tax-advantageous for some people, but less so for others. Note that I am only incorporating spending on items subject to sales taxes, so mortgage payments, HOA dues, student loan payments and the like are excluded. Households A through D represent people in their working years, while E envisions a typical retiree couple drawing down their retirement accounts.
Figure 6: Five Hypothetical Households Analyzed

Winners and Losers
Averaging across the five well-to-do households, Wyoming scored the best. Wyoming is among nine states with no state income taxes (AK, FL, NH, NV, SD, TN, TX, WA are the others). Wyoming is also tied for fourth for lowest median property taxes at 0.55% of assessed value and has a below average sales tax of 5.33%. As depicted in Figure 7, Alaska, Nevada, Florida, and Tennessee round out the top five for lowest overall tax schemes.
Meanwhile, it may be of little surprise that New York scored the worst. The Empire State is among the seven most taxing states for income taxes, ranks 37th for property taxes, and 41st for sales taxes. Iowa, New Jersey, Illinois, and Vermont round out the bottom five. Check out the Appendix to see the prevailing state tax rates for each household.
Figure 7: State Tax Rankings
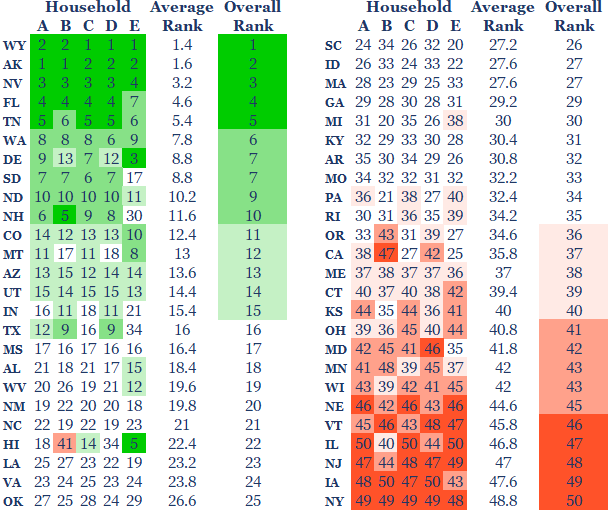
Source: Tax Foundation, Glass Lake Wealth Management analysis
Although each states’ rankings are mostly similar across the theoretical households, a few states stand out. Texas, the second most populous state, ranks highly among working households owing to its lack of an income tax, but ranks poorly for our retiree household because property taxes average the 7th highest in the country and sales taxes average the 14th highest. It makes sense that the eight other states with no income taxes do not look as attractive for retirees, but the differences are less stark.
Conversely, Hawaii looks like a fabulous place to retire for tax purposes (notwithstanding its expensive real estate and high overall cost of living). The state hits its residents hard on income taxes (among the five highest states), but property taxes are the lowest in the country and sales taxes are the 6th lowest. Other states that rank comparatively well for retirees include Delaware, Montana, West Virginia, South Carolina, California, and Oregon.
Other Considerations
In addition to states’ income, property, and sales taxes, there are two additional items that merit consideration – social security taxation and estate taxes. Whether a state taxes social security benefits is a biggie for those already collecting or soon about to. As a reminder, one may begin collecting social security as young as 62 with a smaller benefit, at age 67 for a standard benefit, or age 70 for a maximum benefit. Thirteen states tax social security income, including otherwise tax-friendly states Colorado and Utah (see Figure 8 for the full list).
There are also 17 states you would rather not die in if you have a big estate that will be left for others. These states either have an estate or inheritance tax, or both in the case of Maryland. The levies can be quite high. For example, Oregon’s estate tax starts at 10% on estates greater than $1 million and goes up to 16%. In New Jersey, an inheritance tax rate of 11% begins on amounts in excess of $25,000 unless the beneficiary is a spouse, civil partner, direct descendant or ancestor, or stepchild.
Figure 8: Social Security and Estate Taxing States

Source: Tax Foundation
Solvency Ramifications
For those expecting to live in a state for many years, it is also prudent to consider the state’s financial health to gauge whether citizens’ overall tax burdens will worsen over time. Three indicators to help us assess this likelihood are the state’s pension funded level, debt as a percentage of GDP, and credit ratings. States with low pension funded ratios and/or high debt levels are more likely to eventually seek to raise additional revenue to appease pension beneficiaries and/or maintain healthy solvency. Further, states may wish to optimize their credit rating to secure needed funding at acceptable interest rates, often through tax hikes.
Residents of Illinois, who already face the 4th-highest tax scheme in my analysis, should be most worried about rising taxes because their state pension funded level is 2nd-lowest at 39%, with pension payments consuming nearly 30% of their fiscal 2022 budget. Further, Illinois’ S&P credit rating is the nation’s worst at BBB-, just above junk status. Meanwhile, residents of South Dakota, Nebraska, Tennessee, North Carolina, and Iowa should feel most assured that additional revenue will not be a high priority for at least the intermediate term, based on the data in Figure 9.
Figure 9: States’ Credit Metrics
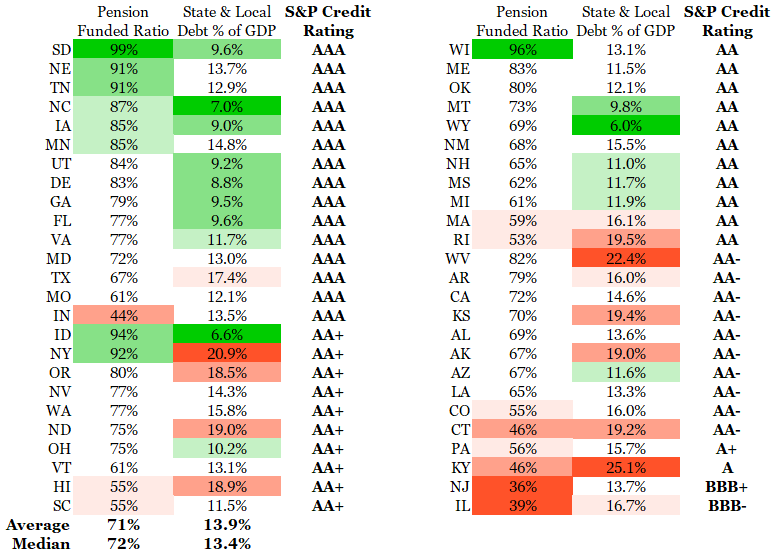
Source: Tax Foundation (Pension Funded Ratio), USgovernmentspending.com (Debt % of GDP), California State Treasurer (S&P credit ratings), Glass Lake Wealth Management analysis
Bottom Line
Tax policy is just one of many factors when deciding where to live, but it is an important component to the cost-of-living equation. On this basis, most of the Northeast and Midwest look like poor choices, while much of the South and West (California and Oregon are notable exceptions) are relative tax havens. Higher taxes, combined with generally higher overall cost of living and harsher weather, explains much of the ongoing migration away from the Frost Belt to the Sun Belt states, which is being accelerated by the work-from-home movement.
Older Americans should be mindful of the 13 states that tax social security payments, while those who will be leaving wealth to a non-spouse should be aware of the 17 states that have estate or inheritance taxes. Finally, a reminder that tax policy is not static. The states that are struggling with big unfunded pensions or piles of debt are likely to become more tax burdensome over time. Conversely, the financially prudent states have the means to actually cut taxes.
Appendix: Tax Rates for Each State
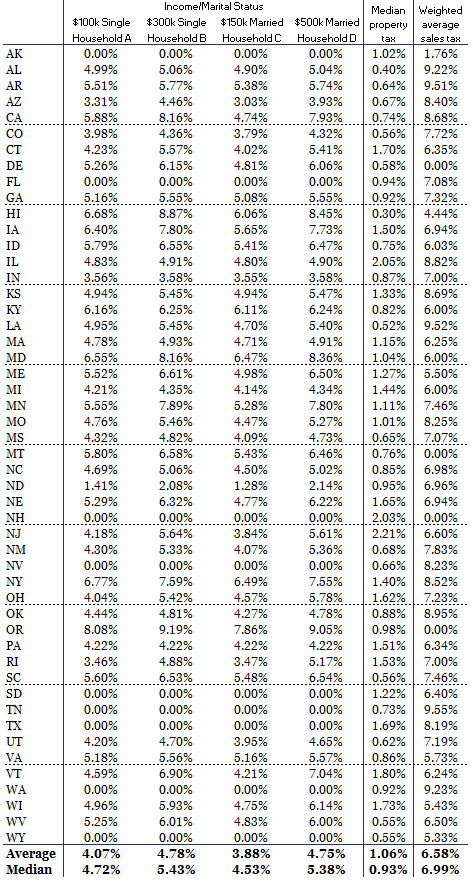
Source: Tax Foundation, Glass Lake Wealth Management analysis
Disclaimer
Advisory services are offered by Glass Lake Wealth Management LLC, a Registered Investment Advisor in the State of Illinois. Glass Lake is an investments-oriented boutique that offers a full spectrum of wealth management advice.
The investment letter expresses the views of the author as of the date indicated and such views are subject to change without notice. Glass Lake has no duty or obligation to update the information contained herein. Further, Glass Lake makes no representation, and it should not be assumed, that past investment performance is an indication of future results. Moreover, whenever there is the potential for profit there is also the possibility of loss.
The investment letter and financial planning article are being made available for educational purposes only and should not be used for any other purpose. The information contained herein does not constitute and should not be construed as an offering of advisory, legal, or accounting services or an offer to sell or solicitation to buy any securities or related financial instruments in any jurisdiction. Certain information contained herein concerning economic trends or market statistics is based on or derived from information provided by independent third-party sources. Glass Lake Wealth Management believes that the sources from which such information has been obtained are reliable; however, it cannot guarantee the accuracy of such information and has not independently verified the accuracy or completeness of such information or the assumptions in which such information is based.