The Great Migration — Which States Make for a Tax-Smart Move
By Jim Krapfel, CFA, CFP
July 1, 2021
One of the many revelations stemming from the Covid-19 pandemic was that normally office-bound employees can be highly productive working from home. While most employers are offering hybrid work arrangements, others are allowing employees to fully work from home. Indeed, big companies such as Amgen, Capital One, Facebook, Pinterest, Salesforce, Snowflake, Square, Twitter, and Zillow have announced post-pandemic policies that give a sizeable portion of their respective workforces the option of where they would like to work.
The growing number of work-from-home employees, unconstrained by proximity to the company office, has driven a “great migration” away from expensive cities and states to more affordable areas. Taxes figure prominently into the cost-of-living equation, so in this financial planning article I examine each state’s tax regime to see which offer the best tax-smart move. The overall rankings might not surprise you, but there is considerable nuance depending on a household’s financial situation and life stage.
Methodology
I focused on state and local income taxes, property taxes, and sales taxes because these are the big three tax buckets people pay into at the state and local level. Income taxes were applied at prevailing states’ rates after standard deductions and exemptions, with average county and city taxes added in for the 10 states that have these taxes (AL, IA, IN, KY, MD, MI, MO, NY, OH, PA). Notably, New York City’s income tax rates range from 3.078% to 3.876%, but I have only incorporated the 1.47% average state-wide city tax into my analysis.
Meanwhile, property tax rates were applied at the average state level. Of course, counties and cities within each state can have vastly different property tax levies. Finally, sales taxes were applied on a weighted-average basis across each state. Here again, different counties and cities will have varying tax rates. To keep the analysis from becoming overly complex, I have ignored states’ different policies on taxing things such as gas, groceries, alcohol, and capital gains.
I looked at five hypothetical affluent households that are representative of my typical client and prospect profile to better gauge states’ total taxation. The households are meant to capture how varying income, spending, home values, and marital status can make certain states tax-advantageous for some people, but less so for others. Note that I am only incorporating spending on items subject to sales taxes, so mortgage payments, HOA dues, student loan payments and the like are excluded. Households A through D represent people in their working years, while E envisions a typical retiree couple drawing down their retirement accounts.
Figure 1: Five Hypothetical Households Analyzed

Winners and Losers
Averaging across the five well-to-do households, Wyoming scored the best. Wyoming is among nine states with no state income taxes (AK, FL, NH, NV, SD, TN, TX, WA are the others). Wyoming is also tied for fourth for lowest median property taxes at 0.55% of assessed value and has a below average sales tax of 5.33%. As depicted in Figure 2, Alaska, Nevada, Florida, and Tennessee round out the top five for lowest overall tax schemes.
Meanwhile, it may be of little surprise that New York scored the worst. The Empire State is among the seven most taxing states for income taxes, ranks 37th for property taxes, and 41st for sales taxes. Iowa, New Jersey, Illinois, and Vermont round out the bottom five. Check out the Appendix to see the prevailing state tax rates for each household.
Figure 2: State Tax Rankings
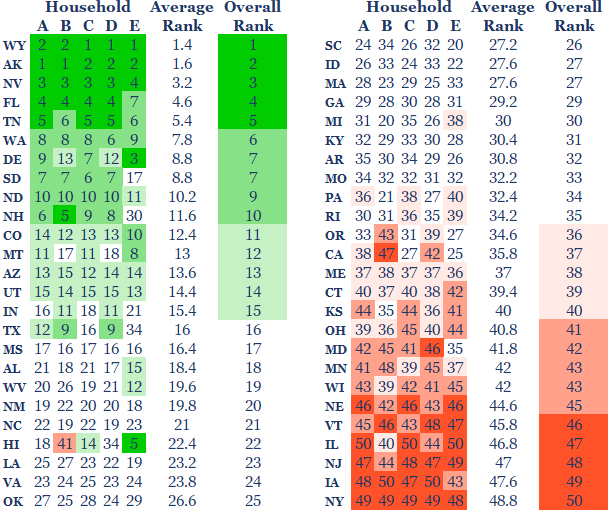
Source: Tax Foundation, Glass Lake Wealth Management analysis
Although each states’ rankings are mostly similar across the theoretical households, a few states stand out. Texas, the second most populous state, ranks highly among working households owing to its lack of an income tax, but ranks poorly for our retiree household because property taxes average the 7th highest in the country and sales taxes average the 14th highest. It makes sense that the eight other states with no income taxes do not look as attractive for retirees, but the differences are less stark.
Conversely, Hawaii looks like a fabulous place to retire for tax purposes (notwithstanding its expensive real estate and high overall cost of living). The state hits its residents hard on income taxes (among the five highest states), but property taxes are the lowest in the country and sales taxes are the 6th lowest. Other states that rank comparatively well for retirees include Delaware, Montana, West Virginia, South Carolina, California, and Oregon.
Other Considerations
In addition to states’ income, property, and sales taxes, there are two additional items that merit consideration – social security taxation and estate taxes. Whether a state taxes social security benefits is a biggie for those already collecting or soon about to. As a reminder, one may begin collecting social security as young as 62 with a smaller benefit, at age 67 for a standard benefit, or age 70 for a maximum benefit. Thirteen states tax social security income, including otherwise tax-friendly states Colorado and Utah (see Figure 3 for the full list).
There are also 17 states you would rather not die in if you have a big estate that will be left for others. These states either have an estate or inheritance tax, or both in the case of Maryland. The levies can be quite high. For example, Oregon’s estate tax starts at 10% on estates greater than $1 million and goes up to 16%. In New Jersey, an inheritance tax rate of 11% begins on amounts in excess of $25,000 unless the beneficiary is a spouse, civil partner, direct descendant or ancestor, or stepchild.
Figure 3: Social Security and Estate Taxing States

Source: Tax Foundation
Solvency Ramifications
For those expecting to live in a state for many years, it is also prudent to consider the state’s financial health to gauge whether citizens’ overall tax burdens will worsen over time. Three indicators to help us assess this likelihood are the state’s pension funded level, debt as a percentage of GDP, and credit ratings. States with low pension funded ratios and/or high debt levels are more likely to eventually seek to raise additional revenue to appease pension beneficiaries and/or maintain healthy solvency. Further, states may wish to optimize their credit rating to secure needed funding at acceptable interest rates, often through tax hikes.
Residents of Illinois, who already face the 4th-highest tax scheme in my analysis, should be most worried about rising taxes because their state pension funded level is 2nd-lowest at 39%, with pension payments consuming nearly 30% of their fiscal 2022 budget. Further, Illinois’ S&P credit rating is the nation’s worst at BBB-, just above junk status. Meanwhile, residents of South Dakota, Nebraska, Tennessee, North Carolina, and Iowa should feel most assured that additional revenue will not be a high priority for at least the intermediate term, based on the data in Figure 4.
Figure 4: States’ Credit Metrics

Source: Tax Foundation (Pension Funded Ratio), USgovernmentspending.com (Debt % of GDP), California State Treasurer (S&P credit ratings), Glass Lake Wealth Management analysis
Bottom Line
Tax policy is just one of many factors when deciding where to live, but it is an important component to the cost-of-living equation. On this basis, most of the Northeast and Midwest look like poor choices, while much of the South and West (California and Oregon are notable exceptions) are relative tax havens. Higher taxes, combined with generally higher overall cost of living and harsher weather, explains much of the ongoing migration away from the Frost Belt to the Sun Belt states, which is being accelerated by the work-from-home movement.
Older Americans should be mindful of the 13 states that tax social security payments, while those who will be leaving wealth to a non-spouse should be aware of the 17 states that have estate or inheritance taxes. Finally, a reminder that tax policy is not static. The states that are struggling with big unfunded pensions or piles of debt are likely to become more tax burdensome over time. Conversely, the financially prudent states have the means to actually cut taxes.
Appendix: Tax Rates for Each State

Source: Tax Foundation, Glass Lake Wealth Management analysis
Disclaimer
Advisory services are offered by Glass Lake Wealth Management LLC, a Registered Investment Advisor in the State of Illinois. Glass Lake is an investments-oriented boutique that offers a full spectrum of wealth management advice.
This article is being made available for educational purposes only and should not be used for any other purpose. The information contained herein does not constitute and should not be construed as an offering of advisory, legal, or accounting services or an offer to sell or solicitation to buy any securities or related financial instruments in any jurisdiction. Certain information contained herein is based on or derived from information provided by independent third-party sources. Glass Lake Wealth Management believes that the sources from which such information has been obtained are reliable; however, it cannot guarantee the accuracy of such information and has not independently verified the accuracy or completeness of such information or the assumptions in which such information is based.