1Q 2026 Investment Letter
April 1, 2026
In the first quarter of 2026, the stock market faced a new, significant headwind that tested its resilience. The market exited 2025 on a high note, capping off a third consecutive year of double-digit market returns. However, the sudden outbreak of war against Iran at the end of February injected a fresh dose of volatility into global markets, forcing investors to reevaluate the macroeconomic landscape. Despite a sharp rally on March 31, the S&P 500 (SPY) finished the quarter down 4.4% inclusive of dividends.
This past quarter saw a pronounced rotation out of technology, consumer cyclical and communication services, and into more defensive energy, materials, consumer staples, and utilities. These sectors have stocks that generally align with growth and value classifications, respectively. The diverging performance of the Russell 1000 Growth (IWF) and Russell 1000 Value (IWD) ETFs illustrate this well, as shown in Figure 1 below.
Figure 1: Markets Plunged in March as Iran War Begun, Especially Growth Stocks
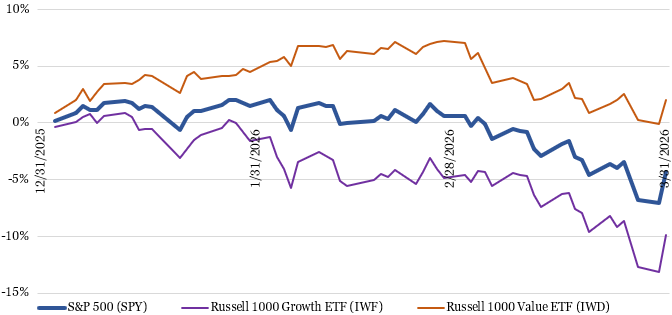
Source: Koyfin (inclusive of dividends)
Driving growth stocks down in the quarter were concerns that (1) hyperscalers such as Microsoft (MSFT), Amazon (AMZN), and Alphabet (GOOG) were morphing from asset light into asset heavy businesses because of the capital expenditures required to build out internal and external needs for artificial intelligence (AI) infrastructure; (2) software companies will ultimately get intermediated by AI-native startups; and (3) higher Treasury yields can constrain the valuation multiples investors are willing to pay for more-distant earnings streams.
Supporting value stocks were (1) the direct beneficiaries of the Iran War, from traditional energy companies, metals & mining operators, chemical producers, and defense companies; and (2) a flight to safety in less cyclical, more stable, and non-AI threatened consumer staples, regulated utilities, and large pharmaceuticals. The durability of this rotation will largely depend on the course of the Iran War and how the AI infrastructure supercycle continues to unfold.
Economic data that preceded the war’s onset indicate a resilient economy. Employers continue to add workers (though mostly in healthcare; hiring for white collar business workers remains low), the unemployment rate is at a healthy 4.4%, and retail sales continue to advance. Further, it appears AI is already boosting productivity, with labor productivity improving by 2.2% in 2025 versus 1.9% averaged over the last 10 years and 1.7% averaged over last 20 years. Productivity improvements are likely to only accelerate from here, helping to constrain inflation.
However, the economy is increasingly K-shaped with higher earners, long-time homeowners, and those holding large stock portfolios doing particularly well, while those new to the workforce, student debt holders, and first home seekers struggling with scant high-pay job opportunities, resumed student debt payments, persistently unaffordable home prices, and high energy costs.
The Iran War complicates the picture for the Federal Reserve. Going into this year, expectations were that a soon-to-be-chosen new Fed chair (Kevin Warsh was nominated on January 30) would cut rates further given President Trump’s strong desire to lower rates to supercharge the economy. Now, the Fed faces the distinct risk of inflation reaccelerating if the Fed cuts rate too aggressively in the face of energy-driven supply shocks. So, instead of two more 25-basis point cuts anticipated by the market for this year, there is some debate if the Fed’s next move is to raise rates.
Treasury yields faced heightened volatility in the quarter as bond markets grappled with the inflationary impacts of the energy supply shocks and the downward impacts on growth. The net impact was a 47-basis point (one basis point is 0.01%) rise in 10-year Treasury yields from immediately prior to the first missiles fired to the peak on March 27. Higher yields are typically headwinds for stocks by (1) making bonds more competitive with stocks; (2) making companies’ future earnings less valuable today; and (3) increasing interest expense for indebted companies.
Figure 2: Treasury Yields Rose Since the Iran War Broke Out
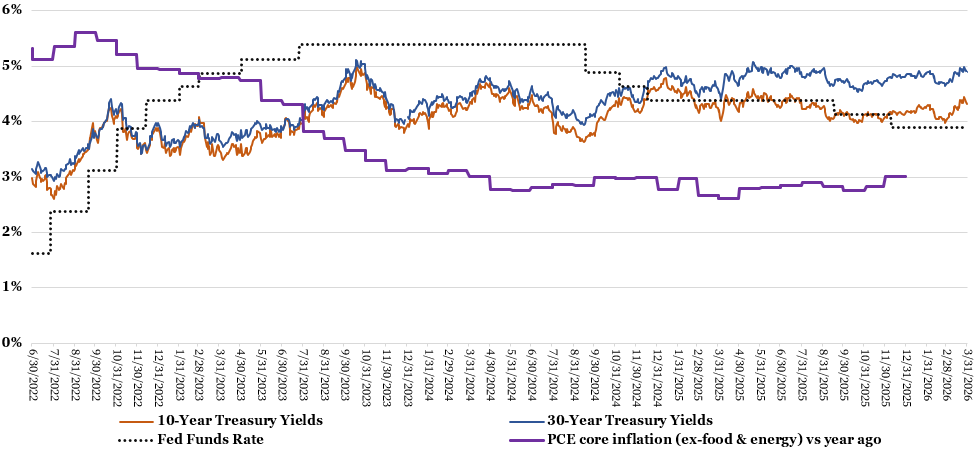
Sources: St. Louis Fed/Board of Governors of the Federal Reserve System. https://fred.stlouisfed.org/series/DGS10 (10-year US Treasury yield). https://fred.stlouisfed.org/series/DGS30 (30-year US Treasury yield) https://fred.stlouisfed.org/series/PCEPILFE (PCE inflation ex-food & energy). Forbes Advisor. https://www.forbes.com/advisor/investing/fed-funds-rate-history/ (Fed Funds rate).
Market Outlook
Much of the market's trajectory for the remainder of 2026 will depend on the duration and severity of the Iranian conflict, especially as it pertains to the flow of crude oil and other essential commodities through the Strait of Hormuz. Roughly 20% of global oil consumption, 20% of global liquified natural gas (LNG) shipments, 33% of global fertilizer trade, and 33% of global helium (essential for semiconductor manufacturing) supply normally passes through the Strait.
Predicting how the situation will evolve and ultimately resolve is very difficult. War headlines come out fast and furious and are often contradictory. What we do know is that Trump does not want a protracted war, having often mused about the ill-advised wars in Iraq and Afghanistan, and is actively looking for an off ramp. He deeply cares about public opinion, the economy, and the stock market. A complication is that reopening the Strait is not a unilateral decision and will likely need cooperation from Gulf region and other allies.
Evaluating stock market performance during prior wars is reassuring. For instance, Fundstrat’s Tom Lee noted that in seven out of seven major conflicts since 1900, the stock market bottomed within the first 10% of the conflict’s duration. A separate study by RBC Wealth Management of 20 major military interventions found that the S&P 500 fell by an average of 6% to reach its trough, took 13 to 18 trading days to find its bottom, and recovered to pre-conflict levels typically within 28-39 days. That said, past performance is not always indicative of future results, so this time could be different if commodity flow curtailments drag on.
Another large underlying engine of the stock market remains the AI infrastructure supercycle. Suppliers of AI infrastructure continue to see robust activity, with all signs pointing to the investment cycle continuing through at least 2027. If signs emerge that AI-driven capital expenditures might ebb, that ought to benefit the hyperscalers who would see improved free cash flows and potentially ease some of the sentiment overhang on software companies, while pressuring AI infrastructure stocks like semiconductors and others selling into data centers. Alternatively, if AI spending continues unabated, then the market’s view of AI winners and losers should remain the same.
Worth mentioning is that 2026 is a midterm election year. These years have historically been the worst of the presidential cycle, with the S&P 500 finishing the year higher just 53% of the time with an average gain of 4.6%, with the other three years finishing up 78% of the time, with an average gain of 11%. It is possible that much of the market-friendly tax and regulatory changes by the current administration have already been priced into the stock market over the past couple of years, leading to below average returns this year.
As I have said many times before, it is next to impossible to successfully time the stock market consistently. I remain steadfast in my belief that everyone is best served in staying true to a long-term asset allocation that makes sense given their own return objective, risk tolerance, and time horizon. The markets have a way of defying the consensus view while generating strong returns over time.
Client Positioning
I take a long-term view that focuses on compounding returns in a tax-efficient manner. I allocate the bulk of my clients’ equity exposure to “quality growth” companies that possess durable competitive advantages, above-average long-term growth prospects, high levels of profitability and free cash flows, and prudent levels of debt. I generally take a “pruning the weeds and nurturing the flowers” approach of selling stocks that violate my investment thesis and retaining stocks of companies with solid fundamentals. I believe this investment philosophy affords my clients the best shot of generating maximum after-tax, risk-adjusted returns compounded over the long run.
Portfolio activity was moderate in the first quarter. The biggest change was buying a good-sized position in GE Vernova (GEV), an energy equipment manufacturer that is a prime beneficiary from the AI buildout’s power needs. The new position, purchased on February 23rd at ~$820/share, was funded by selling a good chunk of our high weighting in Microsoft (MSFT) and taking modest trims to our medium weighting in Eaton (ETN) and small weighting in PTC (PTC). For clients with silver holdings, I methodically trimmed their Physical Silver Shares ETF (SIVR) during silver’s parabolic move higher in January.
Figure 3: Portfolio Changes in Majority of Client Accounts in 1Q 2026
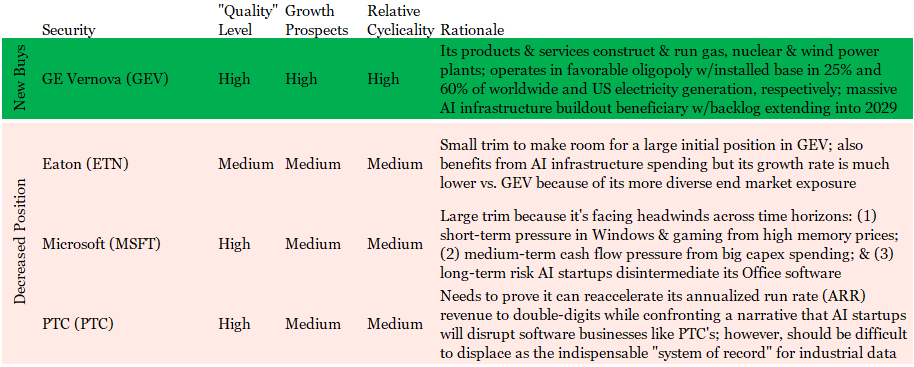
Source: Glass Lake Wealth Management
Traditional energy stocks are having their moment amid the significant supply disruptions, but I will not be chasing them higher. I put energy stocks in the long-term challenged bucket alongside other industries like airlines and automobile manufacturers. I also continue to avoid the most speculative areas of the market such as unprofitable “story” stocks, recent special purpose acquisition companies (SPACs) and pump-and-dump meme stocks.
For clients’ fixed income portfolios, I continue to focus on short to medium duration holdings (duration is a measure of a bond price’s sensitivity to changes in interest rates; when interest rates rise, bond prices fall). I want to abstain from high duration bonds because I do not believe long-term Treasury yields adequately reflect the United States’ fiscal situation and monetary policy risks from a dovish future Fed Chair Warsh (though Senate confirmation could be tied up for a while).
I will look to increase clients’ equity allocation if the stock market comes under further pressure to the extent that client has the ability and willingness to take additional risk. Moments of stock market dislocation always prove to be great entry points, even if not evidenced immediately.
Have a happy, healthy, and wealthy spring season!
Sincerely,

Jim Krapfel, CFA, CFP
Founder/President
Glass Lake Wealth Management, LLC
glasslakewealth.com
608-347-5558
Disclaimer
Advisory services are offered by Glass Lake Wealth Management LLC, a Registered Investment Advisor in Illinois and North Carolina. Glass Lake is an investments-oriented boutique that offers a wide spectrum of wealth management advice. Visit glasslakewealth.com for more information.
This investment letter expresses the views of the author as of the date indicated and such views are subject to change without notice. Glass Lake has no duty or obligation to update the information contained herein. Further, Glass Lake makes no representation, and it should not be assumed, that past investment performance is an indication of future results. Moreover, whenever there is the potential for profit there is also the possibility of loss.
This investment letter is being made available for educational purposes only and should not be used for any other purpose. The information contained herein does not constitute and should not be construed as an offering of advisory, legal, or accounting services or an offer to sell or solicitation to buy any securities or related financial instruments in any jurisdiction. Certain information contained herein concerning economic trends or market statistics is based on or derived from information provided by independent third-party sources. Glass Lake Wealth Management believes that the sources from which such information has been obtained are reliable; however, it cannot guarantee the accuracy of such information and has not independently verified the accuracy or completeness of such information or the assumptions in which such information is based.