January 2022 Investment Letter
January 4, 2022
Once again the stock market displayed its resilience to interrelated economic challenges in the fourth quarter -- an Omicron variant super-surge in Covid-19 cases, continued supply constraints, and escalating inflation. A late December rally lifted the Russell 3000 (ticker IWV), a broad measure of market performance, to a 9.2% quarterly return. This brought the full year return to an impressive 25.5%, with an unusually low level of volatility. The biggest drawdown in the index was a mere 5.1% from November 8 to December 1.
Figure 1: Major Market Indexes Mostly Performed Well in 2021
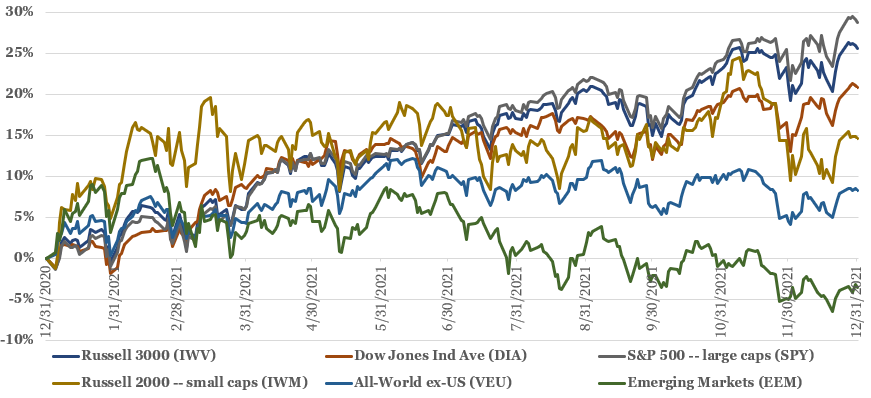
Source: Yahoo Finance (inclusive of dividends)
There were certainly divergences within markets. The big winners of 2021 were:
a handful of large capitalization growth stocks – Microsoft (MSFT) up 52%, Alphabet (GOOG) up 65%, Tesla (TSLA), up 50% and Nvidia (NVDA) up 125%
energy stocks – iShares US Energy ETF (IYE) up 53%, SPDR S&P Oil & Gas Exploration & Production ETF (XOP) up 67%
housing stocks – iShares US Home Construction ETF (ITB) up 49%, Home Depot (HD) up 59%, Lowe’s ( LOW) up 63%
Covid-19 vaccine manufacturers – Pfizer (PFE) up 65% and Moderna (MRNA) up 143%
banks – Invesco KBW Bank ETF (KBWB) up 38%
Equity returns in 2021 generally got progressively weaker as one ventured further afield from highly-profitable, large capitalization U.S. companies:
small capitalization stocks -- iShares Russell 2000 ETF (IWM) up 15%
speculative, hypergrowth, and/or unprofitable companies -- Cathie Wood’s ARK Innovation ETF (ARKK) down 24%, Renaissance IPO ETF (IPO) down 10%, Defiance Next Gen SPAC Derived ETF (SPAK) down 25%
international stocks – Vanguard FTSE All-World ex-US ETF (VEU) up 8%, iShares MSCI Emerging Markets ETF (EEM) down 4%
Other asset classes mostly had good years. Commodity prices such as crude oil (up 55%) and natural gas (up 47%) were up almost across the board. Meanwhile, real estate investments were broadly up, including U.S. home prices which soared another 19.1% from year ago levels in October. Also rising substantially were cryptocurrencies, with Bitcoin up 60% and Ethereum up 409%.
One of the few poorly performing asset classes was the $52 trillion U.S. bond market. The iShares Core U.S. Aggregate Bond ETF (AGG) fell 2% as its low initial yield was overcome by rising rates (bond prices move inversely to interest rate movements). The traditional 60/40 asset allocation between stocks and bonds has been blown up in this low interest rate environment. Other notable laggards were precious metals such as gold (IAU) and silver (SIVR), which were down 4% and 12%, respectively.
Now that we have touched on 2021 performance, let us dive into the major factors driving the market and my views of how 2022 could play out.
My Outlook
Upcoming legislation
The Biden administration went one and one in its legislative agenda in the fourth quarter, passing the $1 trillion infrastructure bill but accepting defeat on the $3.5 trillion “Build Back Better” (BBB) bill that contained climate and social policy initiatives. Centrist Democratic Senator Joe Manchin of West Virginia killed prospects for passing BBB because of his concerns regarding the true cost of the bill and the inflationary impacts it could have. Still, it is highly possible that Manchin and Arizona’s Krysten Sinema, the other senator who pushed back on elements of the bill, will agree to a significantly scaled down version.
The greatly reduced size of any successful legislation, along with the likely absence of feared tax increases, augurs for a limited stock market reaction to any passage.
Covid-19
The ongoing pandemic has dragged out longer than any of us imagined and has been highly unpredictable. The latest variant to take hold, Omicron, has led to new records in U.S. caseloads and has disrupted global economic activity once again. Actual case counts are likely multiple times greater than depicted below because of the shortage of tests and the growing share of at-home tests that go unreported.
Figure 2: New Reported Cases of Covid-19 through January 4
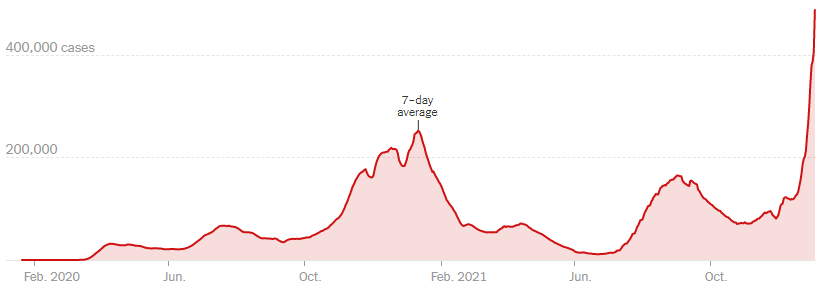
Source: New York Times. Updated 1/4/22. https://www.nytimes.com/interactive/2021/us/covid-cases.html
Still, there is welcome tradeoff between contagiousness and sickness severity with Omicron. In South Africa, where Omicron first percolated, Covid-19 cases peaked several weeks ago with relatively few deaths. Further, British health officials reported that people with Omicron were about half as likely to be hospitalized as those with the Delta variant and were only one-third as likely to need emergency care. In the U.S., the increase in hospitalizations has not come close to keeping up with case counts, even when adjusting for the typical lag from a positive test to hospitalization.
Scientists say that Omicron cases may peak in the U.S. in mid-January and burn out as quickly as cases surged. Where we go from there is anyone’s guess. My hope is that the next variant to emerge will continue the trend of increased transmissibility but lessened severity, to the point that catching it is no worse than a common cold. I think we could all live with that.
To the extent that this optimistic scenario comes true, I would expect a resurgence in economic reopening areas of the stock market, particularly in travel-related companies, and cyclical stocks generally. Even if moderate Covid-19 severity continues indefinitely, better prevention (from majority of Americans being fully vaccinated & boosted) and treatment options (such as Pfizer’s pill shown to be 89% effective in preventing hospitalizations and deaths) ought to keep us living mostly normal lives.
Inflation
Covid-19 has greatly disrupted global supply chains, ultimately driving shortages across many product categories. What’s more, the health and social effects of Covid-19, and to a certain extent government aid, have forced or encouraged would-be workers to stay home. These factors have driven PCE inflation to soar to 5.7% in November, the highest since 1982.
Figure 3: Inflation Readings Have Skyrocketed Over the Past Few Months

Sources: FRED citing the U.S. Bureau of Economic Analysis. https://fred.stlouisfed.org/series/PCEPI. https://fred.stlouisfed.org/series/PCEPILFE
Fast-rising wages -- average hourly earnings increased 4.8% year-over-year in November -- have the potential to spur a wage-price spiral that defined the 1970s. However, I expect inflation to peak in the next few months as supply constraints start to ease, government stimulus ebbs, and the Fed withdraws some of its accommodative monetary support. Still, I think we are likely to see inflation remain well above 2% into 2023.
The Federal Reserve/10-year treasury yields
The Fed and its influence on interest rates are the biggest determining factors to market performance in the year ahead, in my opinion. When interest rates are low, stocks’ future cash flows are worth more in the present. Low rates also make bonds relatively unattractive to stocks because they give investors little income and directly suffer when interest rates rise.
Despite a more hawkish Federal Reserve over the past three months, as I will highlight momentarily, 10-year U.S. treasury yields have barely budged. The current interest rate structure provides a fertile environment for stocks.
Figure 4: 10-yr US Treasury Yields Remain Supportive of Stocks
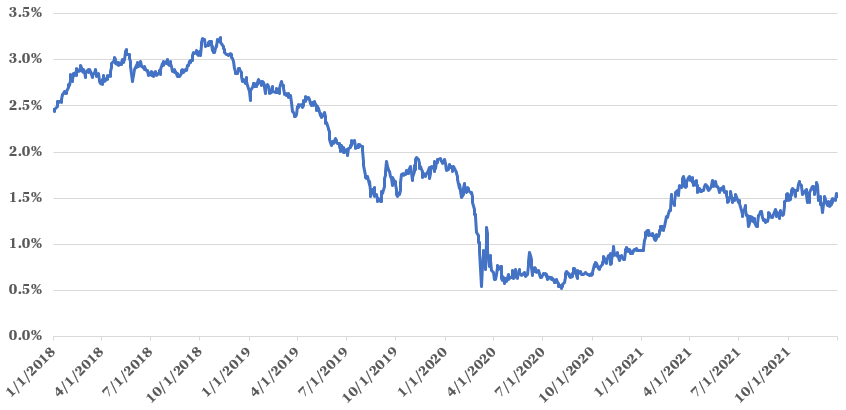
Source: U.S. Department of the Treasury. https://www.treasury.gov/resource-center/data-chart-center/interest-rates/Pages/TextView.aspx?data=yield
Let me explain. As of December 31, the inverse of the 10-year treasury yield of 1.52% is 65.8, meaning you have to pay $65.80 for each $1 of interest income. Now compare that to the oft-cited S&P 500, which trades for 22.8x consensus earnings over the next 12 months, and you can see the wide valuation difference.
As such, the price to acquire treasury’s safety looks very rich compared to stocks that should see earnings growth over time. Indeed, S&P 500 earnings are expected to follow 2021’s 46% gain with a 9% increase in 2022. Other fixed income alternatives, such as corporate bonds, municipal bonds, and bank notes, typically have better yields than U.S. treasuries but they introduce some credit (default) risk and still do not compete well against equities. Of course, support for equities could falter if interest rates reset meaningfully higher.
To be sure, the Federal Reserve is waking up to the more persistent than expected period of high inflation. In early November, Fed officials agreed to reduce their then-$120 billion a month in bond purchases by $15 billion per month. At its next meeting conclusion on December 15, the Fed announced they will accelerate the purchase reduction to $30 billion per month, putting the program on track to end by March. Furthermore, a majority of the 18 Fed officials expect its Fed Funds rate to increase by 0.25% at least three times (from 0.1% currently) in 2022, at least three times in 2023, and at least twice in 2024. This compares to about half of officials who in September thought rate increases would not be warranted until 2023.
Whether raised short-term rates push the influential 10-year treasury yield higher remains to be seen. The first two trading days of 2022 indicate that could be the case, with the 10-year yield jumping 0.13% to 1.65%. If the 10-year yield pierces the 2% level, then I could see the overall market temporarily pulling back at least 10% with yield-sensitive growth stocks getting hit harder. If rates remain sub-1.75%, then I think the market could easily increase in the double-digit percentages again in 2022 with growth stocks performing at least in line with the overall market.
Client Positioning
I take a long-term view that focuses on compounding returns in a tax-efficient manner. You will not see me make dramatic asset allocation changes based on my views of legislation, Fed policy, or other factors. Further, I allocate the bulk of my clients’ equity positions in “quality growth” names that have strong and sustainable competitive advantages, above-average long-term growth prospects, high levels of profitability and free cash flows, and prudent levels of debt. I believe this investment philosophy affords my clients the best shot of generating maximum after-tax, risk-adjusted returns compounded over the long run.
Indeed, I continue to invest around 80% of clients’ equity allocations in companies I would characterize as “quality growth.” The remainder of clients’ portfolios continue to be invested in a mix of low- to medium- quality, highly cyclical companies that should more fully benefit from an ongoing economic reopening. Many of our quality growth companies have above-average cyclicality, so they stand to disproportionately benefit from a resurgent economy too. Overall, clients should expect their equity portfolio to do best versus the market when growth outperforms value and 10-year treasury yields remain tame.
Figure 5: Portfolio Changes in Majority of Client Accounts in 4Q 2021

Source: Glass Lake Wealth Management
Portfolio changes in the fourth quarter were primarily made for idiosyncratic, or company-specific reasons. Part of the sell rationale was to harvest losses before the end of the year to help offset realized gains. Overall portfolio cyclicality was little changed. I anticipate some reduction in client portfolio’s cyclical exposure once economies more fully reopen (again) to attain fuller portfolio harmony with my investment philosophy.
All the while, you are highly unlikely to see me dabble in the most speculative, unprofitable areas of the market, such as in alternative energy, space exploration, Reddit-fueled meme stocks, or SPACs. As always, I will keep an open mind and be on the hunt for the next great long-term investment.
I hope you and your loved ones stay happy, healthy, and wealthy in the new year.
Sincerely,

Jim Krapfel, CFA, CFP
Founder/President
Glass Lake Wealth Management, LLC
glasslakewealth.com
608-347-5558
Disclaimer
Advisory services are offered by Glass Lake Wealth Management LLC, a Registered Investment Advisor in the State of Illinois. Glass Lake is an investments-oriented boutique that offers a full spectrum of wealth management advice.
The investment letter expresses the views of the author as of the date indicated and such views are subject to change without notice. Glass Lake has no duty or obligation to update the information contained herein. Further, Glass Lake makes no representation, and it should not be assumed, that past investment performance is an indication of future results. Moreover, whenever there is the potential for profit there is also the possibility of loss.
The investment letter and financial planning article are being made available for educational purposes only and should not be used for any other purpose. The information contained herein does not constitute and should not be construed as an offering of advisory, legal, or accounting services or an offer to sell or solicitation to buy any securities or related financial instruments in any jurisdiction. Certain information contained herein concerning economic trends or market statistics is based on or derived from information provided by independent third-party sources. Glass Lake Wealth Management believes that the sources from which such information has been obtained are reliable; however, it cannot guarantee the accuracy of such information and has not independently verified the accuracy or completeness of such information or the assumptions in which such information is based.