New Landlords Face More Challenging Economics
By Jim Krapfel, CFA, CFP
May 1, 2024
Investing in residential rental property has long been viewed as an effective means to generate passive income and build long-term wealth. Public data is scarce, but rental home investing platform Arrived estimates that the historical total return over the past 20 years has been 9.6% per year for all-cash property purchasers and 11.7% per year for those who financed 65% of the purchase price. That is some impressive wealth creation.
However, there is ample reason to believe new landlords are likely to encounter a much more difficult financial proposition. In this blog, I provide an in-depth framework for evaluating the economics of rental property investment, give scenario analysis around potential returns, and compare those returns to other investment options.
The Income Equation
Investors in residential real estate receive their total return from three sources – (1) home price appreciation; (2) principal paydown if there is a mortgage; and (3) net rental income, that is rent collected minus costs to operate, such as mortgage payment (if applicable), repairs and maintenance, property insurance, property taxes, homeowners’ association dues, and income taxes. Let us evaluate each income source.
Income source #1: home price appreciation
Home price appreciation has contributed greatly to rentals’ total returns historically. Over the last 20 years, the average single-family home price increased by 121%, with a cumulative average growth rate (CAGR) of 4.0%. Since the inception of the S&P CoreLogic Cash-Shiller Home Price Index in 1987, home prices increased by 387%, with a CAGR of 4.4%.
Home prices have increased so much that they have become unaffordable for many. As I highlighted in my buy versus rent blog last year, home prices were already inflated, and it has only gotten worse. According to Case-Shiller data, national home prices increased another 3.3% over the last 15 months and the average 30-year fixed mortgage rate climbed to 7.2% from 6.1%. The level of unaffordability can be seen on the following three graphs that plot home prices to income, home prices to rents, and mortgage payments to income.
Figure 1: Home Prices are Historically Unaffordable Relative to Incomes…
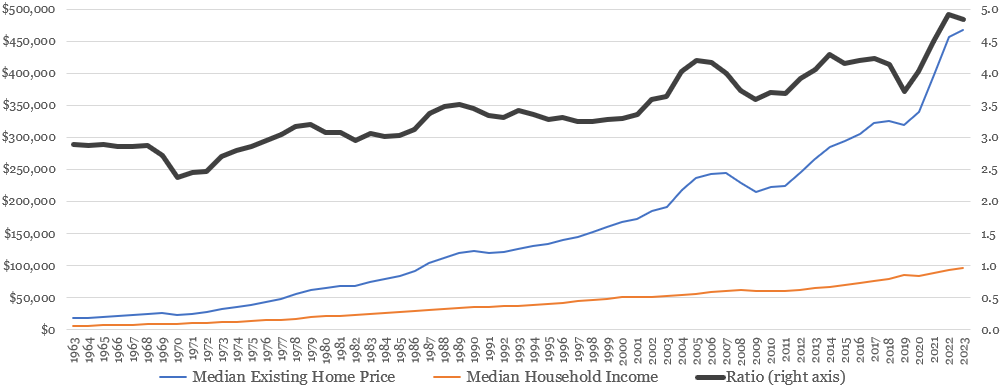
Sources: St. Louis Fed citing the US Census Bureau and Housing and Urban Development (median home prices) https://fred.stlouisfed.org/series/MSPUS; St. Louis Fed citing S&P Dow Jones Indices LLC (Case-Shiller home prices) https://fred.stlouisfed.org/series/CSUSHPISA; St. Louis Fed citing the U.S. Census Bureau (median household income) https://fred.stlouisfed.org/series/MEFAINUSA646N; Glass Lake Wealth Management analysis
Figure 2: …and Unaffordable to Rents
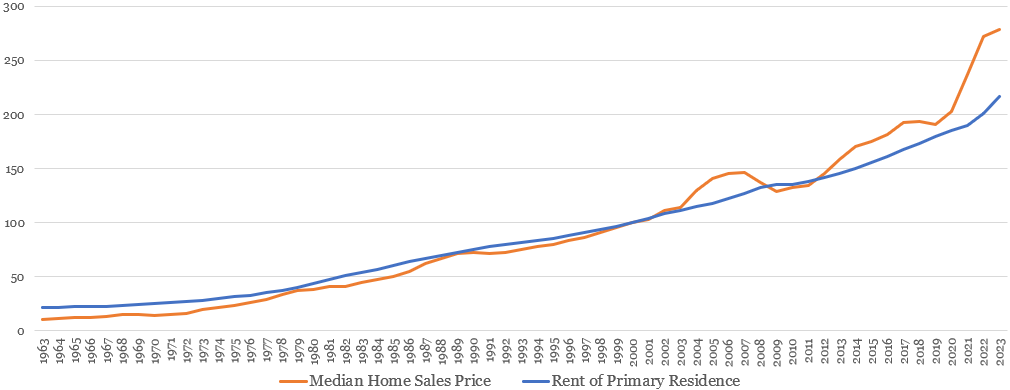
Sources: St. Louis Fed citing the US Census Bureau and Housing and Urban Development (median home prices) https://fred.stlouisfed.org/series/MSPUS; St. Louis Fed citing the U.S. Bureau of Labor Statistics (rent data) https://fred.stlouisfed.org/series/CUUR0000SEHA; Glass Lake Wealth Management analysis
*Median home price and rent data are indexed to 100 in 2000
**To eliminate the significant effects sales mix has on median home prices, Case-Shiller Home Price Index percentage changes was applied to 2019 existing home prices in Figures 1 and 2
Figure 3: Mortgage Payments Relative to Incomes are Also Extended

Sources: St. Louis Fed citing the US Census Bureau and Housing and Urban Development (median home prices) https://fred.stlouisfed.org/series/MSPUS; St. Louis Fed citing the U.S. Census Bureau (median household income) https://fred.stlouisfed.org/series/MEFAINUSA646N; St. Louis Fed citing Freddie Mac (30-Year Fixed Rate Mortgage) https://fred.stlouisfed.org/series/MORTGAGE30US; Glass Lake Wealth Management
*Mortgage payment assumes 20% down on a median priced home financed with the average prevailing 30-year fixed mortgage rate
As such, it would be imprudent to assume that house prices continue to appreciate at historical rates. I find it likely that these affordability metrics revert to long-term averages over time, especially as the large Baby Boomer generation releases housing supply and the large Millennial generation moves past their peak home buying years. A reasonable assumption in the decades to come is that home prices rise in-line with inflation, which I assume to be 2.5%.
Income source #2: principal paydown
Those who finance their real estate investment purchase also gain equity over time by paying their mortgage. Over the full course of a 30-year mortgage, a buyer with 20% down on a $1 million purchase would have gained $800,000 of equity irrespective of the change in home price. That works out to $26,667 on average per year.
The problem is loan amortization schedules are such that payments in the earlier years have a much higher composition of interest payments over principal payments, and the higher interest rates today exacerbate this. Assuming a 30-year fixed mortgage at 8%, just 9.5% of the first year’s mortgage payments would be applied to principal! Even in years 5 and 10, the principal portion of the total payments would only represent 13% and 19%, respectively, of the total payments. Clearly the longer you hold the property, the better the economics become.
Figure 4: Principal Paydown Ramps Slowly When Interest Rates are 8%
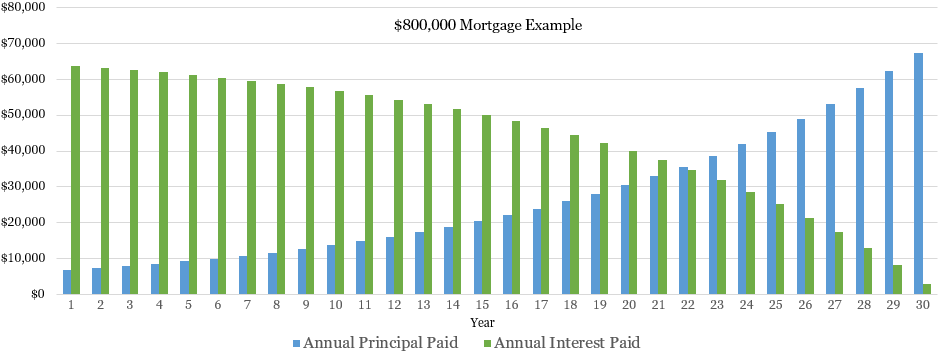
Source: Glass Lake Wealth Management analysis
Income source #3: net rental income
Rental income is the main reason people get into real estate investments – the reliable (mostly), passive (partly) income source that is uncorrelated (largely) with investment returns that could be earned elsewhere.
Estimating what you can charge for rent necessitates market research of the prevailing rental rates in the area, considering location, property size and quality, and amenities. Broadly speaking, the gross rental yield, or the annualized rent charged divided by property value, ought to be lower than historically available because of inflated home values relative to rents, as shown in Figure 2.
Be sure to haircut your assumption for gross rental yield to account for tenant vacancy and rent nonpayment. According to the U.S. Census Bureau, rental vacancies averaged 6.6% across the United States in the first quarter of 2024, slightly below historical averages. Vacancy rates tend to be higher for apartments and condos and lower for single-family homes. You are at higher risk for tenant nonpayment if the property is in a low-income area, but gross rental yields are usually highest there.
The costs of operating a rental unit can vary a lot and are specific to the property in mind. Property taxes certainly figure prominently. In a prior blog on Which States Make for a Tax-Smart Move, I found that median property taxes can range from as low as 0.30% in Hawaii to 2.21% in New Jersey. The median state assessed property taxes at 0.93% of estimated home value. Look to see how your municipality applies property tax.
Maintenance and repairs are another big cost bucket. In general, the older the property and the less willingness and ability you have to handle things like lawn care and fixing leaks, the more it will cost you. A good rule of thumb is to budget 1% of the home value on maintenance and repair costs annually. It could make sense to budget a higher percentage for single-family houses and a lower percentage for condos.
Homeowner’s insurance is a smaller but growing cost item. According to Forbes, the average homeowner’s insurance rate on a $500,000 policy is $2,212 (0.44% of coverage amount). Costs are rising rapidly with larger and more frequent natural disasters, with average rates nationally up 6.2% in 2022 and 11.3% in 2023, and I expect insurance premiums to continue rising faster than inflation. A particular property’s insurance is influenced by (1) location – such as propensity for natural disasters, crime, overhanging trees, proximity to fire hydrant and fire department; (2) type of home – for instance, concrete block homes have less fire risk than wood framed homes; (3) roof type, construction, and shape; (4) claims history, and (5) desired coverages and deductibles.
Of course, you must deduct the mortgage amount over its term, if applicable. Note that mortgage rates for investment properties are typically at least 0.50% to 0.75% higher than owner-occupied properties because they carry more risk for lenders. If you hire a property management company, expect to pay 8-12% of the gross monthly rent. Finally, do not forget homeowners association (HOA) dues if they apply.
The great thing about owning a rental is that you can have cash flowing every month (though not necessarily today if financing at today’s higher interest rates) and usually do not have to pay any income tax on the rental income. The ability for rental property owners to depreciate their property over 27.5 years makes this possible. For instance, if you purchased a $1 million property, you would apply $36,000 of depreciation expense annually for 27.5 years to offset all or most of your rental income.
Landlord for Life
Thus far, the analysis assumes that the rental property is owned indefinitely. Selling a rental investment without utilizing what is known as a 1031 exchange can have severe tax consequences. That is because the depreciation expense that shields your rental income from income tax must be recaptured upon sale. For example, if you own your $1 million purchased rental property for 10 years, then you will have depreciated 36.4% (10/27.5) of the purchase price, which lowers your cost basis to $636,000. If you sell your property for $1.5 million, you will pay long-term capital gains tax on $864,000 of income ($1.5 million – $636,000).
Generating so much income in one year will put you in a high tax bracket. At present, the long-term capital gains tax rate jumps from 15% to 20% with over $518,900 of taxable income for singles and over $583,750 for married people filing jointly. What’s more, single filers with at least $200,000 of modified adjusted gross income (MAGI) and joint married filers with at least $250,000 of MAGI are also subject to a 3.8% net investment income tax on capital gains.
However, capital gains tax can be deferred indefinitely if you utilize a 1031 exchange. A 1031 exchange can be utilized when you do all of the following: (1) sell real estate held for business or investment purposes and hold the sales proceeds with a qualified intermediary; (2) identify “like-kind” properties to potentially buy within 45 days of the sale (most real estate will be like-kind to other real estate); and (3) close on one or more of the replacement properties within 180 days. Consult the IRA Fact Sheet and this updated IRA tax tips page for more specifics on 1031 Exchanges.
Thus, the only way to never pay capital gains tax is to be a landlord for life. Upon your death, your real estate investments receive a step-up in basis to its fair market value, just like other investments such as stocks. Neither your estate nor your heirs pay any capital gains tax upon your death.
Calculating Potential Returns of Real Estate Investments
Now that we have walked through the primary considerations, we can do the math to see if buying an investment property is financially sound. I developed a model to crunch the numbers and conduct scenario analysis using 19 inputs.
Below I show the results of a couple hypothetical purchase scenarios – one is 80% financed at 8% for 30 years, and the other is all cash. Key assumptions in both scenarios that can be easily changed:
annual home price appreciation of 2.5%
gross rental yield (rent charged / purchase price) of 6.5% with a vacancy rate of 7%
annual rent increases of 2.5%
property tax of 1% of home value
maintenance & repair of 1% of home value
property insurance of 0.4% of home value that annually increases by 3%
monthly HOA dues of $50 monthly that annually increases by 2.5%
total transaction fees of 2.5% when buying and 4% when selling, and
capital gains tax rate of 28.8% (20% capital gains rate + 3.8% net investment income tax + 5% state income tax)
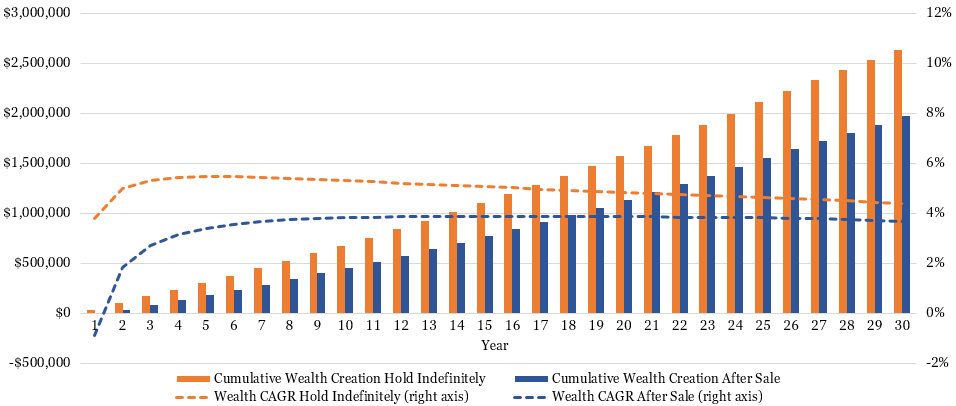
Figure 5: Wealth Creation Holding Indefinitely vs Selling; Purchase 80% Financed at 8%

Source: Glass Lake Wealth Management analysis
Figure 6: Wealth Creation Holding Indefinitely vs Selling; All-Cash Purchase
Source: Glass Lake Wealth Management analysis
The headline conclusion is that with these assumptions, you could earn an annualized total return of 6.8% over 30 years if you financed 80% of the purchase at an 8% mortgage rate, or 4.4% over 30 years if you purchased using all cash, if you never sell the property. However, you do not actually start cash flowing positive until the mortgage is paid off in 30 years in the financing scenario (all the returns come from building home equity), whereas you start cash flowing to the tune of $36,000 in the first year in the no-mortgage scenario.
There are a few other important observations from the wealth creation charts. First, when you mostly finance the purchase at today’s interest rates, it takes a long time before an acceptable return is earned. This makes sense given the high proportion of interest in the mortgage payment for so many years. Second, financing the purchase magnifies returns in both directions, which is true whenever debt is used to make an investment. Third, opting to sell an investment property without utilizing a 1031 exchange dramatically reduces potential returns, especially when the property is financed and owned for less time.
Opportunity Cost Overview
We can determine if the potential real estate returns are acceptable by comparing them to alternative investment opportunities. The most obvious alternative for those with a decade-plus investment horizon is the stock market. How you invest in the market can have a profound impact on returns, such as large cap versus small, growth versus value, and domestic versus international.
A good representation of the U.S. stock market is the S&P 500 Index, which dates back to 1928. The average annualized total return (with dividends) since inception through Dec 31, 2023 is 9.9%. Average annualized returns over the last 20 years have been a similar 10.2%, and over the last 10 years have been an impressive 13.1%. Of course, past performance is not necessarily indicative of future results. Going forward I expect less pronounced returns, largely due to higher-than-historical corporate profit margins and elevated market valuations at present. A reasonably conservative stock return assumption is 7% annually.
The other substantial, readily investible asset class is fixed income. Here too, there are many ways to invest, with higher total returns generally expected the riskier the issuer and the longer the time to bond maturity. However, reaching for higher yield can backfire if the issuer’s creditworthiness is questioned or if interest rates rise (a bond’s value declines when interest rates rise).
One way to assess the historical returns for the bond market is the iShares Core U.S. Aggregate Bond ETF, which tracks the total U.S. investment-grade bond market. Since its inception in 2003, the average annualized return has been a pedestrian 3.0%, reflecting the prevailing low interest rate environment. Meanwhile, we have data on the 10-year U.S. Treasury bond and long-term corporate bond markets going back to 1928. Since then, annualized returns were 4.6% and 6.7%, respectively. Currently, the 10-year U.S. Treasury yields 4.6%, and riskier bonds yield more, so a reasonable assumption for future bond returns is 5% annually.
Bottom Line
New investors in residential real estate are likely to generate much lower returns than historically achieved because of elevated home prices and high interest rates. At present only savvy, long-term oriented real estate investors are likely to generate greater long-term wealth than what can be achieved via a mix of traditional investments like stocks and bonds. If you do not commit to being a life-long landlord, then you will be hard-pressed to earn an acceptable return because of the large tax due upon property sale.
Still, residential real estate can make sense for some. If the carefully analyzed potential returns of a particular opportunity are sufficiently attractive, you do not mind the extra time and hassle in managing a rental (or the diminished returns of outsourcing this), and you plan to own the rental property indefinitely, then you should feel confident in incorporating this asset class into your overall asset allocation.
Disclaimer
Advisory services are offered by Glass Lake Wealth Management LLC, a Registered Investment Advisor in Illinois and North Carolina. Glass Lake is an investments-oriented boutique that offers a full spectrum of wealth management advice. Visit glasslakewealth.com for more information.
This blog is being made available for educational purposes only and should not be used for any other purpose. The information contained herein does not constitute and should not be construed as an offering of advisory, tax, legal, insurance or accounting services or an offer to sell or solicitation to buy insurance, securities, or related financial instruments in any jurisdiction. Certain information contained herein is based on or derived from information provided by independent third-party sources. Glass Lake Wealth Management believes that the sources from which such information has been obtained are reliable; however, it cannot guarantee the accuracy of such information and has not independently verified the accuracy or completeness of such information or the assumptions in which such information is based.