TJX’s Customers and Investors Go Treasure Hunting
By Jim Krapfel, CFA, CFP
September 1, 2023
Background
The TJX Companies (ticker TJX) was an existing position in my predecessor firm’s primary stock portfolio when I joined as an analyst in 2015. I was initially skeptical that it had the necessary growth runway and margin expansion opportunity to make it a worthy holding in a concentrated portfolio. However, I came around to the idea that its differentiated business model and continued strong execution warranted continued ownership.
I started buying TJX across Glass Lake Wealth Management client accounts at around $61 in November 2020, seven months after my launching my firm. Since then, it has been a medium-sized position and was the 9th largest aggregate stock position as of August 31, 2023.
Company Description
TJX is an off-price apparel and home fashions retailer in the United States and worldwide. It has over 4,800 stores and five distinct branded e-commerce sites that offer a rapidly changing assortment of merchandise at prices generally 20% to 60% below full-price retailers’ regular prices on comparable merchandise, every day.
TJX operates the following segments:
Marmaxx – consists of 1,299 T.J. Maxx stores in the U.S., 1,183 Marshalls stores in the U.S., 78 Sierra stores in the U.S., and their respective e-commerce sites.
T.J. Maxx and Marshalls sell off-price family apparel (including footwear and accessories), home fashions (including home basics, decorative accessories and giftware), and other merchandise.
T.J. Maxx and Marshalls are differentiated through different product assortments, with T.J. Maxx generally offering higher quality merchandise.
Sierra, rebranded from Sierra Trading Post in 2018, sells off-price brand name active and outdoor apparel, footwear, and gear (including sporting goods, snow and water sport, camping, fishing).
HomeGoods – consists of 894 HomeGoods stores in the U.S., 46 Homesense stores in the U.S., and their respective e-commerce sites.
HomeGoods sells off-price home fashions, including furniture, rugs, lighting, soft home, decorative accessories, tabletop and cookware, as well as expanded pet and gourmet food departments.
Homesense complements HomeGoods, offering a differentiated mix and expanded departments, such as large furniture, ceiling lighting and rugs, as well as a general store.
TJX Canada – consists of 297 Winners stores in Canada, 151 HomeSense stores in Canada, and 106 Marshalls stores in Canada, and their respective e-commerce sites.
Winners sells off-price family apparel and home fashions.
TJX International – consists of 629 T.K. Maxx stores in Europe, 78 Homesense stores in Europe, and 74 T.K. Maxx stores in Australia, and their respective e-commerce sites.
T.K. Maxx offers a merchandise mix similar to T.J. Maxx’s.
Figure 1: Sales by Operating Segments in Fiscal 2023*
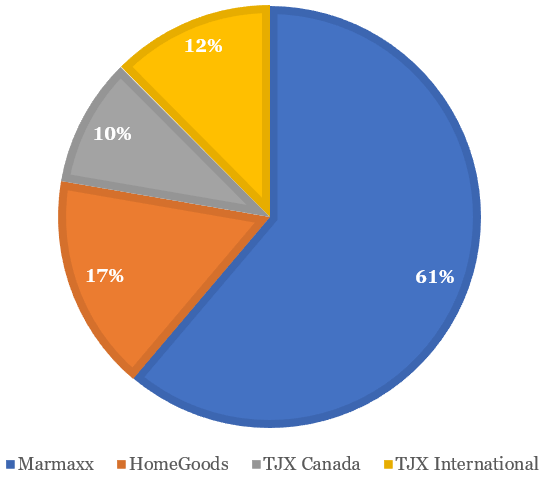
*Fiscal 2023 means the 52-week fiscal year ended January 28, 2023
Sources: Company filings, Glass Lake Wealth Management
T.J. Maxx opened its first stores in 1977 and it acquired Winners in 1990, introduced HomeGoods in 1992, launched T.K. Maxx in 1994, acquired Marshalls in 1995, acquired Sierra in 2012, and launched Homesense in 2017. It went public in 1987, is headquartered in Framingham, Massachusetts, and carries a dividend yield of 1.5%.
Investment Thesis
We own TJX for the long term primarily because (1) I expect it to continue to gain market share in retail, and (2) there is room to grow its worldwide store count. I also believe the company can operate well in most operating environments, making the stock less volatile than those with greater economic cyclicality or more uncertain outlooks.
Our expectation for continued market share gains stems from its track record of operating much better than most of its peers. While traditional retailers such as Macy’s (ticker M), Kohl’s (ticker KSS), and Bed, Bath & Beyond (ticker BBBYQ) shuttered stores over the years as same-store-sales waned, TJX has continually expanded, growing its store count by 19% over the last five years and by 59% over the last 10 years. Furthermore, there have been only two years since it went public in which same-store-sales were negative, with one of those years being fiscal 2021 (covering February 2020 to January 2021) during the height of the Covid-19 pandemic.
TJX’s outperformance has really shined through recently. In its latest earnings results covering the quarter ended July 29, same-store-sales at its MarMaxx segment were up 8%, compared to Macy’s at down 8% and Kohl’s at down 5%. Dick’s Sporting Goods (ticker DKS) and Foot Locker (ticker FL) also recently reported disastrous earnings results that saw their stocks plummet over 20%. It’s clear that TJX’s treasure hunting experience and merchandise sourcing efforts are resonating with its customers, and I expect that to continue.
Going forward I expect mid-single-digit average same-store-sales growth to be buttressed by 2-4% annual store growth. TJX has stated an estimated total store potential of 6,275, up 29% from current levels. A disproportionate amount of the growth should come from HomeGoods and international expansion. I expect that the 6,275 figure will ultimately be revised higher if its existing stores continue to do well – 10 years ago TJX pegged its total store potential at 4,320-4,730, which it has since surpassed.
TJX’s near-term prospects are perhaps even brighter because margins ought to bounce back from Covid-19-induced headwinds. TJX’s pre-tax profit margins dipped to 9.7% in fiscal 2023 from 10.8% in fiscal 2020, despite 3% greater sales. Its margins were most notably impacted by higher freight costs stemming from driver shortages and a surge of goods purchases during the pandemic. I estimate that higher freight costs had a cumulative 250 basis points (2.5%) headwind to margins from fiscal 2020 to fiscal 2023. I expect TJX to recover at least half of the freight impact over the next two years as driver supply better matches normalized demand. Lower freight costs are already flowing through its income statement with pre-tax margins in its latest earnings report up 120 basis points, and much better than consensus expectations.
Economic Moat
TJX’s economic moat, or sustainable competitive advantages, is a product of its proprietary inventory management system and significant scale. They give TJX significant buying power with its suppliers that allow it to profitably undercut full-price retailers by 20%-60%.
TJX’s off-price business model is all about opportunistic buying, not only for the consumer but also for the company. TJX acquires merchandise at substantial discounts that regularly arise from the production and flow of inventory in the apparel and home fashions marketplaces, which includes order cancellations, manufacturer overruns, closeouts and special production. Its buying strategies are intentionally flexible to allow it to react to frequently changing opportunities and trends in the market to adjust what, how, and when it sources merchandise. Its selling floor space is also flexible, without walls between departments and largely free of permanent fixtures, so it can easily expand and contract departments to accommodate the merchandise it purchases.
In contrast to traditional retailers, which typically order goods far in advance of the time the product appears on the selling floor, TJX’s merchants are in the marketplace frequently looking for opportunities to buy merchandise. Much of the merchandise it buys is for the current or immediately upcoming selling season. A minority is for future seasons, which it refers to as packaway.
TJX also has some private label merchandise that is produced for it under in-house and licensed brands to supplement the depth of or fill gaps in its expected merchandise assortment. The exact mix of inventory it sources between opportunistic purchases and merchandise produced for TJX is not disclosed, but I expect the overwhelming majority to be the former.
What makes TJX an attractive avenue to offload merchandise is that it is typically willing to purchase a less-than-full assortment of items, styles, and sizes as well as quantities ranging from small to very large. TJX is also able to disperse merchandise across a geographically diverse network of stores, it pays promptly, and it generally does not ask for retail concessions, delivery concessions or return privileges. Only Ross Stores (ticker ROST), and to a lesser extent, Burlington Stores (ticker BURL), come to mind in matching TJX’s ability to offload merchandise at scale with similar terms.
Growth, Profitability & Valuation
Over the next five years I expect TJX to grow revenue in the mid- to high-single digit range as same-store-sales grow in the mid-single digits and store count grows 2-4% annually. I do not expect a great deal of variability in its growth rate given its history of steadily growing in almost all economic environments.
In current fiscal year 2024 (ending in January 2024), I expect TJX to exceed its previous goal of recapturing the 10.6% pre-tax margin it achieved in fiscal 2020. Indeed, during its recently reported quarterly results, management raised its fiscal 2024 pretax margin guidance to 10.7-10.8% from 10.2-10.4%. I expect margins to slowly expand thereafter as lower freight costs and operating leverage from higher sales more than offset wage increases and investments to fight shrink (stealing). Regular share buybacks ought to reduce its share count by around 2% annually, resulting in EPS growth averaging in the 10-12% range per year. There is also scope for 10-15% annual dividend increases.
Figure 2: Improved Profitability in Store for TJX
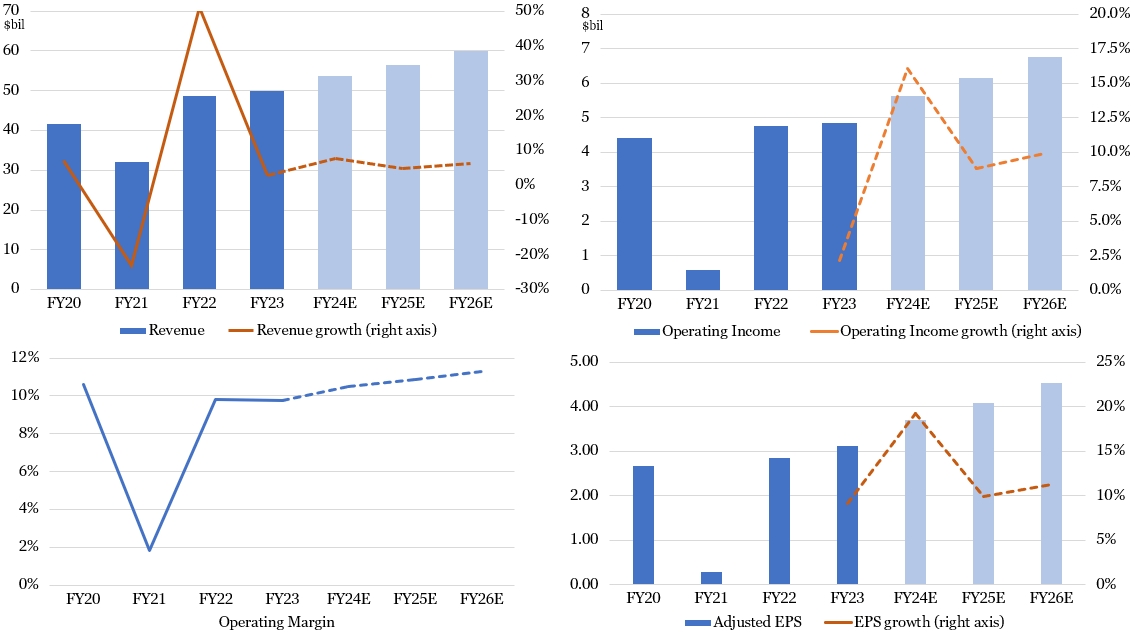
Sources: Company filings (historical results), Koyfin (analysts’ consensus estimates), Glass Lake Wealth Management
TJX is priced at 23.7x next 12 months’ (NTM) consensus earnings, ahead of the S&P 500 at 20.0x NTM. TJX’s valuation multiple is somewhat higher than its 10-year average multiple, excluding the first 12 months of the pandemic when sales and earnings were depressed. I believe its premium valuation has been earned because it has performed well across successive consumer spending cycles that have seen many other retailers shrink or disappear.
Key Risks
The largest idiosyncratic, or company-specific, risk facing TJX is that it faces difficulty in procuring quality merchandise at such deeply discounted levels. It relies, in part, on traditional retailers dumping excess inventories to off-price retailers such as TJX, and to the extent it cannot source inventory because traditional retailers better manage their inventory or become too small to become a reliable inventory source for TJX, then TJX could be adversely impacted.
A second major risk is the increasing prevalence of shrink, or employee and customer stealing. Most publicly traded retailers have recently cited higher shrink as a contributing factor to weaker earnings results, but so far TJX has managed to keep it contained through various initiatives. A third risk is that consumer preferences go so far in the direction of convenient, online shopping, that they forgo the in-store, treasure hunting experience that TJX provides.
Finally, if the economy enters a recession, TJX ought to be less impacted than most consumer spending-oriented companies, but it will be negatively impacted, nonetheless.
Disclaimer
Advisory services are offered by Glass Lake Wealth Management LLC, a Registered Investment Advisor in Illinois and North Carolina. Glass Lake is an investments-oriented boutique that offers a wide spectrum of wealth management advice. Visit glasslakewealth.com for more information.
This blog expresses the views of the author as of the date indicated and such views are subject to change without notice. Glass Lake has no duty or obligation to update the information contained herein. Further, Glass Lake makes no representation, and it should not be assumed, that past investment performance is an indication of future results. Moreover, whenever there is the potential for profit there is also the possibility of loss.
This blog is being made available for educational purposes only and should not be used for any other purpose. The information contained herein does not constitute and should not be construed as an offering of advisory, legal, or accounting services or an offer to sell or solicitation to buy any securities or related financial instruments in any jurisdiction. Certain information contained herein concerning economic trends or market statistics is based on or derived from information provided by independent third-party sources. Glass Lake Wealth Management believes that the sources from which such information has been obtained are reliable; however, it cannot guarantee the accuracy of such information and has not independently verified the accuracy or completeness of such information or the assumptions in which such information is based.