Look Beyond the Sticker Price to Get a Better View into College Costs
By Jim Krapfel, CFA, CFP
August 1, 2023
It is no secret that the cost of going to college is high. Indeed, the average annual cost of college is $36,436, including tuition, books, supplies, and daily living expenses. Most know that the cost of attending a 4-year postsecondary institution can vary widely among public in-state, public out-of-state, and private, which is an average of $26,027, $44,807, and $54,501, respectively. And of course, tuition figures vary widely depending on the individual school.
Not well understood is that merit scholarships and need-based grants covered 26% of the total cost of attending college in the 2021-22 academic year, and 85-90% of that money came from the schools themselves. Schools’ propensity to dole out money varies widely based on their assessment of student need and the school’s financial resources. Private colleges are particularly discerning as they discount their tuition by 49% on average.
Figure 1: How the Typical Family Pays for College
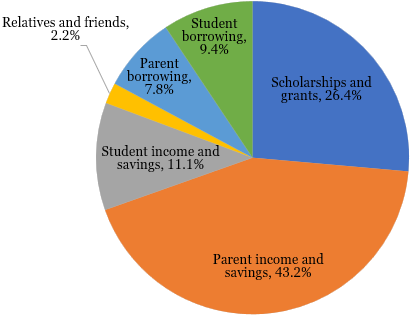
Source: Sallie Mae. “How America Pays for College 2022.” https://www.salliemae.com/about/leading-research/how-america-pays-for-college/
In this financial planning blog, we help prospective students and their parents look beyond largely irrelevant college tuition sticker prices to obtain a sense for what are the true out-of-pocket costs of attending college. This should help identify which schools are likely to bring a level of affordability that makes them worth applying to. For parent and grandparents that have prospective students years away from attending college, read our “529 College Savings Plans Are Best in Class” blog to guide you on the best way fund their education.
Net Price Calculator
A lot of financial information can be gleaned from schools’ net price calculators. A net price calculator, which allows students to estimate the total cost of attendance after grant and scholarship aid based on what similar students paid in a previous year, is required to be posted on all Title IV institutions’ websites that enroll full-time, first-time degree- or certificate-seeking undergraduate students. One can quickly navigate to each school’s net price calculator by going to College Board’s website, finding the university through the search tool, and scrolling down to “Estimate Your Net Cost”.
At a minimum, the institution must disclose:
(1) the estimated total cost of attendance, which includes estimated tuition and fees, room and board, books and supplies, and other expenses (personal expenses, transportation, etc.),
(2) estimated total grant aid,
(3) estimated net price, and
(4) percent of the cohort (full-time, first-time students) that received grant aid
The estimated total grant aid is based on the student’s and parent’s household inputs that inform the university on what it thinks a family can afford to pay for college. At a minimum, institutions’ online calculators must ask for the student’s and parent(s)’ income, number in family, and dependency status. Some seek much more information. As more questions are asked, accuracy of actual scholarships and grants ought to improve.
FAFSA and CSS Profile
Universities’ net price calculators are proxies for the more elaborate form(s) that prospective students must complete to receive aid. One form that is required for all students to qualify for federal student aid -- including scholarships, grants, work-study programs, and loans – is the Free Application for Federal Student Aid (FAFSA). The Department of Education will roll out a new FAFSA in December 2023 for the 2024-25 academic year, but not all schools’ calculators yet reflect the new Student Aid Index (SAI), which replaced Expected Family Contribution (EFC), in determining financial aid need.
The big positive change with the SAI, other than reducing the number of questions to 46 from 108, is that it will allow an additional 1.7 million students to qualify for the maximum Pell Grant, which is worth $7,395 for the 2023-24 school year. The SAI also removes grandparent-owned 529 plans from the ability to pay equation. However, parents with multiple students in college at the same time no longer receive a financial break, small business and family farm assets are now included in the calculation, and children of divorced parents could be adversely impacted if the parent who spent more on the child has greater income and assets than the parent who most lived with the child.
In addition to the FAFSA, the over 400 schools listed here require the CSS Profile and/or IDOC as part of their financial aid process. Although it is more work and comes with a small fee for most applicants, each year the CSS Profile unlocks over $10 billion in institutional, nonfederal financial aid. Keep in mind that having parents with substantial equity on their primary residence could hurt your chances of receiving an award because most schools that utilize the CSS Profile take this into account of what a family can afford, unlike those that rely only on the FAFSA.
Figure 2: FAFSA vs. CSS Profile
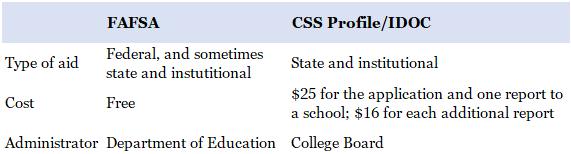
Source: NerdWallet. “CSS Profile vs. FAFSA: How Are They Different.” Updated May 4, 2023. https://www.nerdwallet.com/article/loans/student-loans/know-college-financial-aid-applications
Sampling of Schools’ Net Costs
Let us look at a sampling of schools to see the total gross cost of attendance and net price after grants and scholarships for a hypothetical family. We surveyed the 14 schools currently in the Big Ten conference (UCLA and USC will join in 2024), home to my alma mater University of Wisconsin, as well as the eight schools in the Ivy League. We included the Ivy League because of the relatively high sticker prices but steep discounts offered to many families.
We analyzed two hypothetical households to gauge the sensitivity to family income and assets. Our upper middle-class household received relatively modest grant and scholarship money at half the Big Ten schools, with Northwestern the big generous exception, while the Ivy League schools on average cut the cost by a whopping 56%. Meanwhile, our affluent household was left fronting the full cost of college across the board. We also found the net cost of Big Ten schools to be relatively wide ranging for both in-state and out-of-state students, while the sticker prices of the Ivy League schools were strikingly similar.
Figure 3: Net Annual Price of Attending College for Big Ten and Ivy League Schools
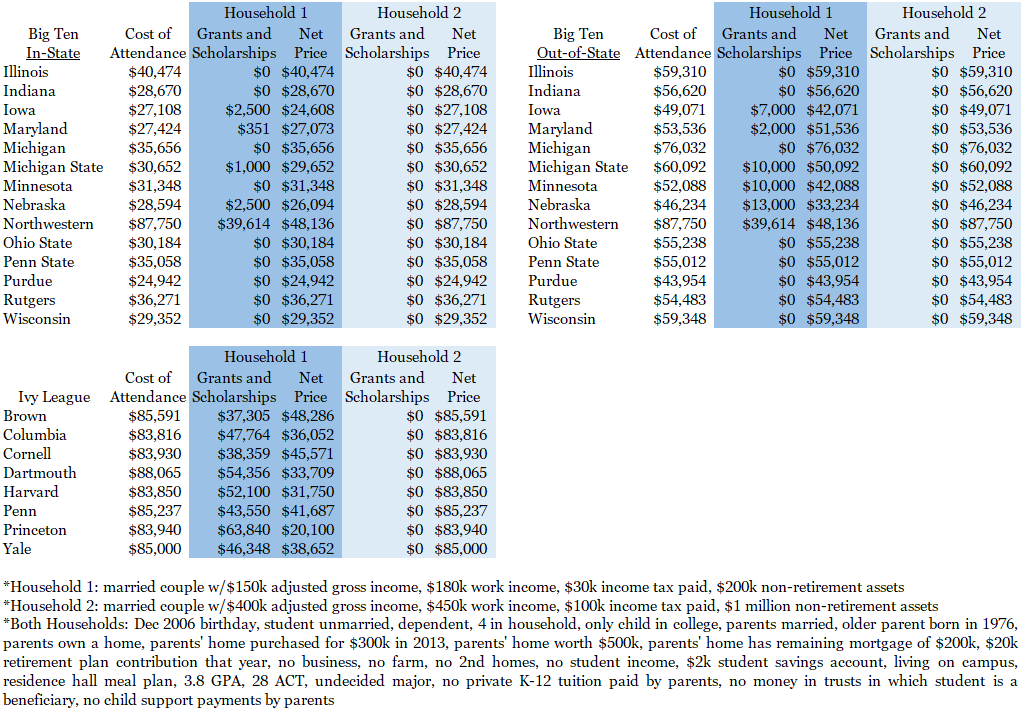
Sources: Collegeboard.org, each school’s “Estimate Your Net Cost Calculator”, Glass Lake Wealth Management analysis
Note that each school asks different questions on its “Estimate Your Net Cost” calculator, so the degree to which actual scholarship and grant money will match what is in the calculator will vary. For instance, we found that the surveyed schools asked about student achievement metrics such as GPA and ACT/SAT scores about half the time. It would not surprise us if the Big Ten schools that did not ask for these figures dole out merit-based scholarship money similarly to the schools that did ask (we used a 3.8 GPA and 28 ACT for the schools that did ask).
Bottom Line
A given university’s sticker price should not necessarily deter you from applying. Most students receive some level of need- and/or merit-based scholarships and grants. The lower the family’s financial prowess relative to the sticker price, and the greater the student’s credentials relative to school’s student body, the more generous the awards are likely to be. You can get a good sense for how schools’ differing need-based formulas and financial resources apply to your family situation by devoting 5-10 minutes to each desired university’s net price calculator.
Disclaimer
Advisory services are offered by Glass Lake Wealth Management LLC, a Registered Investment Advisor in Illinois and North Carolina. Glass Lake is an investments-oriented boutique that offers a full spectrum of wealth management advice. Visit glasslakewealth.com for more information.
This article is being made available for educational purposes only and should not be used for any other purpose. The information contained herein does not constitute and should not be construed as an offering of advisory, legal, insurance or accounting services or an offer to sell or solicitation to buy insurance, securities, or related financial instruments in any jurisdiction. Certain information contained herein is based on or derived from information provided by independent third-party sources. Glass Lake Wealth Management believes that the sources from which such information has been obtained are reliable; however, it cannot guarantee the accuracy of such information and has not independently verified the accuracy or completeness of such information or the assumptions in which such information is based.