Which States Make for a Tax-Smart Move at Retirement
By Jim Krapfel, CFA, CFP
May 1, 2023
Two years ago, amid the peak of the great migration from high-cost to low-cost areas spurred by newfound work-from-home freedom, we highlighted which states make for a tax-smart move. Our analysis largely pertained to working aged people, so here we follow up with a report focused on retirees. We found that retirees’ unique economic characteristics – lapsed work income, introduction of Social Security income, retirement plan distributions, and taxable account selling to fund one’s lifestyle – can change states’ tax friendliness dramatically.
Noneconomic considerations such as weather, recreation, political leanings, and/or proximity to friends and family ought to carry more weight than taxes when choosing where to live after retiring, but our state rankings can serve as an effective tiebreaker. We believe you will not find a more complete picture of states’ tax burden on affluent retirees anywhere else.
Methodology
Like our original analysis, we incorporated the big three tax buckets into our analysis: state and local income tax rates, property tax rates, and sales tax rates. Income taxes were applied at prevailing states’ rates after standard deductions and exemptions, with average county and city taxes added in for the 11 states that have these taxes (AL, DE, IA, IN, KY, MD, MI, MO, NY, OH, and PA). Property tax and sales tax rates were applied on a weighted-average basis across each state.
For our evaluation for retirees, we added states’ varying tax treatment on Social Security income, retirement plan distributions, and capital gains (gains on investments held at least one year). To keep the analysis from becoming overly complex, we ignored states’ differing sales tax policies on other things, such as gas, groceries, alcohol, vehicles, and prescription drugs.
We expanded the number of hypothetical affluent households from five (four working, one retiree) in our original analysis to 16 for our retiree analysis. That way one can identify which household most closely resembles his or her situation with consideration to marital status, investible asset size, home value, and spending level.
Figure 1: Hypothetical Retiree Households Used in Our Analysis
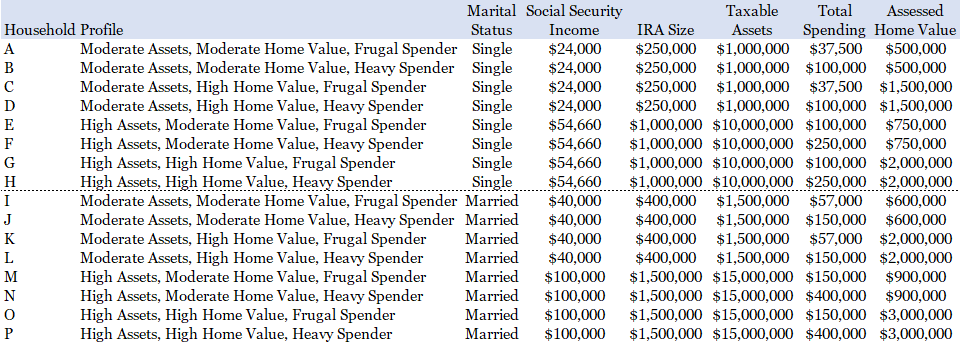
Assumptions: (1) RMD tables utilized for 73-year-olds, (2) 2% yield earned on taxable assets, (3) total spending to be funded from RMD distributions and dividends first, then from taxable accounts that are all long-term capital gains with 100% realized gains, (4) 2% portfolio turnover in taxable accounts that are all long-term capital gains with 100% realized gains, (5) 50% of total spending is subject to state sales tax
Winners and Losers
Averaging across all 16 affluent retiree households, Wyoming has the lowest total tax burden. Wyoming is among nine states (along with AK, FL, NH, NV, SD, TN, TX, and WA) that do not tax any income sources. The Cowboy State also has the ninth lowest median property taxes at 0.61% of assessed value and has a below average sales tax of 5.36%. Alaska, Nevada, Florida, and Tennessee round out the top five.
Meanwhile, Connecticut scored the worst. The Constitution State has the third highest median property tax rate, above average income tax rates, and is among nine states (KS, MN, MO, MT, NM, RI, UT, and VT are the others) that still tax Social Security income with no phase-out in progress. Vermont, New Jersey, Illinois, and Kansas round out the bottom five.
Figure 2: State Tax Rankings
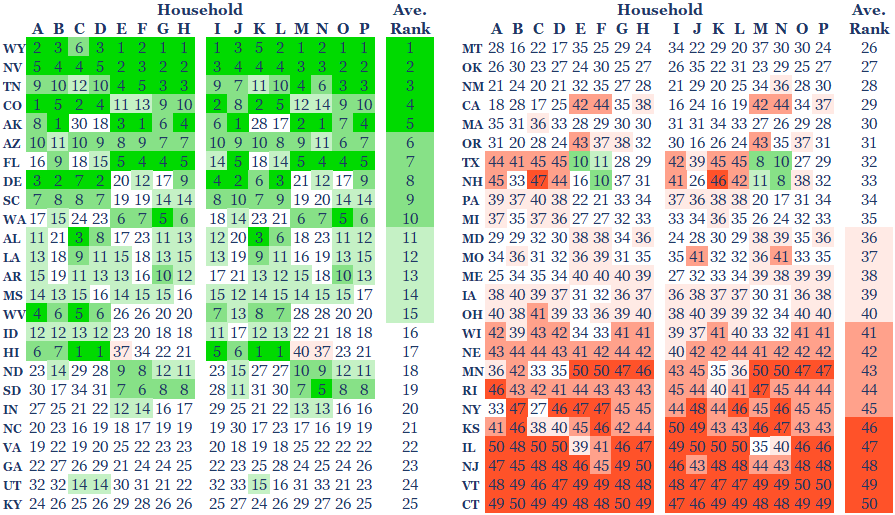
Sources: Tax Foundation (income tax brackets, weighted average sales tax, Social Security taxability, retirement plan taxability), SmartAsset (capital gains rates), The Motley Fool citing the 2021 American Community Services by the U.S. Census Bureau (median property tax rates), Kiplinger.com (property tax exemptions). Glass Lake Wealth Management analysis
Note the significant ranking variability across household profiles for many states. The most pronounced differences across our household profiles were in asset levels. High asset-owning households (1) will be subject to greater required minimum distributions on their pretax retirement accounts, (2) have greater dividend and interest income on their taxable accounts, and (3) have greater capital gains realization on their taxable accounts. So, even though retirees have no work income, they still benefit by living in one of the nine states with no income taxes. Importantly, Illinois, Iowa, Mississippi, and Pennsylvania are four additional states that do not tax income from retirement plans such as 401(k)s, IRAs, or pensions.
The states that score poorly for large asset owners (and resultant greater earning households) generally have highly progressive tax brackets that hit high earners hard.
Figure 3: Outliers in Average Asset Level Rankings
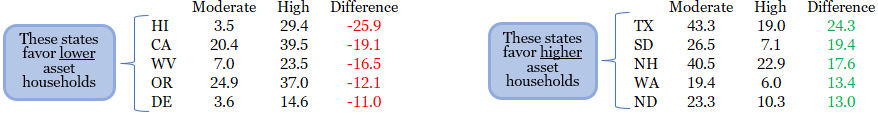
Source: Glass Lake Wealth Management analysis
The second largest differences in our state tax rankings resulted from states’ differing property tax rates and certain deductions and credits offered by some states. The states that ranked better for more expensive home households receive a smaller portion of their tax revenue from property taxes. In other words, states such as Utah, Hawaii, and Alabama generate a greater portion of tax revenue from other sources, such as income and sales taxes. Conversely, states like New Hampshire, Arkansas, and Texas generate an outsized portion of their tax revenue from property taxes.
Figure 4: Outliers in Average Home Value Rankings
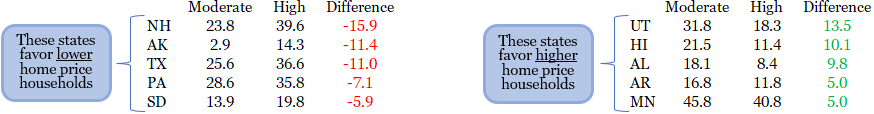
Source: Glass Lake Wealth Management analysis
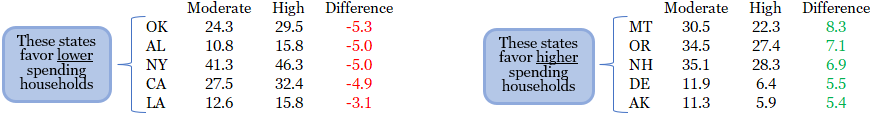
Household spending has a lesser impact on our rankings than asset levels and home prices, but it can still be a needle-mover. Big spenders benefit from living in Delaware, Montana, New Hampshire, and Oregon because these states have no sales taxes. By contrast, the states on the left side of the below table generate an outsized revenue contribution from sales taxes.
Figure 5: Outliers in Average Spending Rankings
Source: Glass Lake Wealth Management analysis
Other Considerations
We ranked states based on their tax burden for retirees, but owners of large estates might consider the tax impact on their heirs too. Large estates could be hit with either an estate tax and/or an inheritance tax for the beneficiaries. As shown below, there are 12 states with an estate tax and five with an inheritance tax that are not in the process of phasing these taxes out.
Figure 6: States That Tax Estates or Inheritances
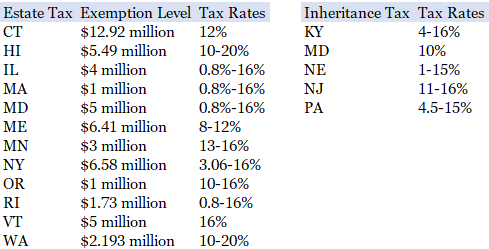
Sources: Tax Foundation, Kiplinger.
For the estate tax, the exemption level reflects the estate size unto which the estate starts to get taxed (amounts within the limit are estate tax-free). For the inheritance tax, spouses are always excluded, certain close relatives may be excluded, and the tax rates may rise for relatives further removed from the decedent (the person who died) and all other people.
Bottom Line
Choosing where to live in retirement can have a major impact on your financial wellbeing. For example, the average married retiree household in our analysis who chooses to live in our worst ranked state – Connecticut – would face an annual tax burden over four times as much ($62,000 vs. $15,000) than our best ranked state – Wyoming. The difference between our 40th ranked state – Ohio – and our 10th ranked state – Washington – is also wide ($46,000 vs. $23,000, respectively, for our married households).
Considerations unique to retirees can alter the tax efficiency equation relative to working people, including: (1) nine states still tax Social Security income, (2) four states do not tax retirement plan income, and (3) some states tax long-term capital gains and property taxes differently for retirees. For example, South Carolina, Arkansas, and Iowa improved from 29th, 33rd, and 49th, respectively, in our prior analysis of four working households to 9th, 13th, and 39th for our average retiree households. Conversely, New Hampshire, Texas, and Connecticut fell from 7th, 11th, and 39th, respectively, to 33rd, 32nd, and dead last.
It's not just the transition from working adult to retirement that makes states relatively more attractive or not from a tax standpoint, but also the profile of the household in terms of asset size (and resulting income), average home value, and spending levels. Households’ asset size particularly influences our rankings. Further, people who expect to leave a large estate might want to avoid living in the 16 states that have an estate or inheritance tax.
APPENDIX: Comparison of our Prior Working Households to our New Retiree Households Rankings
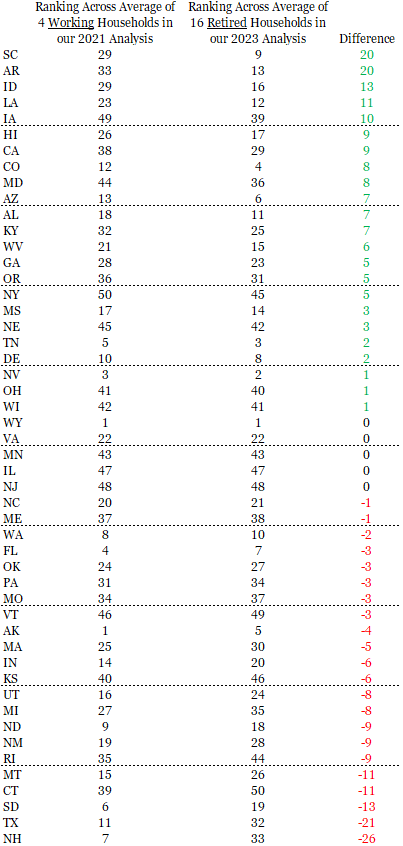
Source: Glass Lake Wealth Management analysis
Disclaimer
Advisory services are offered by Glass Lake Wealth Management LLC, a Registered Investment Advisor in Illinois and North Carolina. Glass Lake is an investments-oriented boutique that offers a full spectrum of wealth management advice. Visit glasslakewealth.com for more information.
This article is being made available for educational purposes only and should not be used for any other purpose. The information contained herein does not constitute and should not be construed as an offering of advisory, legal, insurance or accounting services or an offer to sell or solicitation to buy insurance, securities, or related financial instruments in any jurisdiction. Certain information contained herein is based on or derived from information provided by independent third-party sources. Glass Lake Wealth Management believes that the sources from which such information has been obtained are reliable; however, it cannot guarantee the accuracy of such information and has not independently verified the accuracy or completeness of such information or the assumptions in which such information is based.